Open Access
Fig. 9.
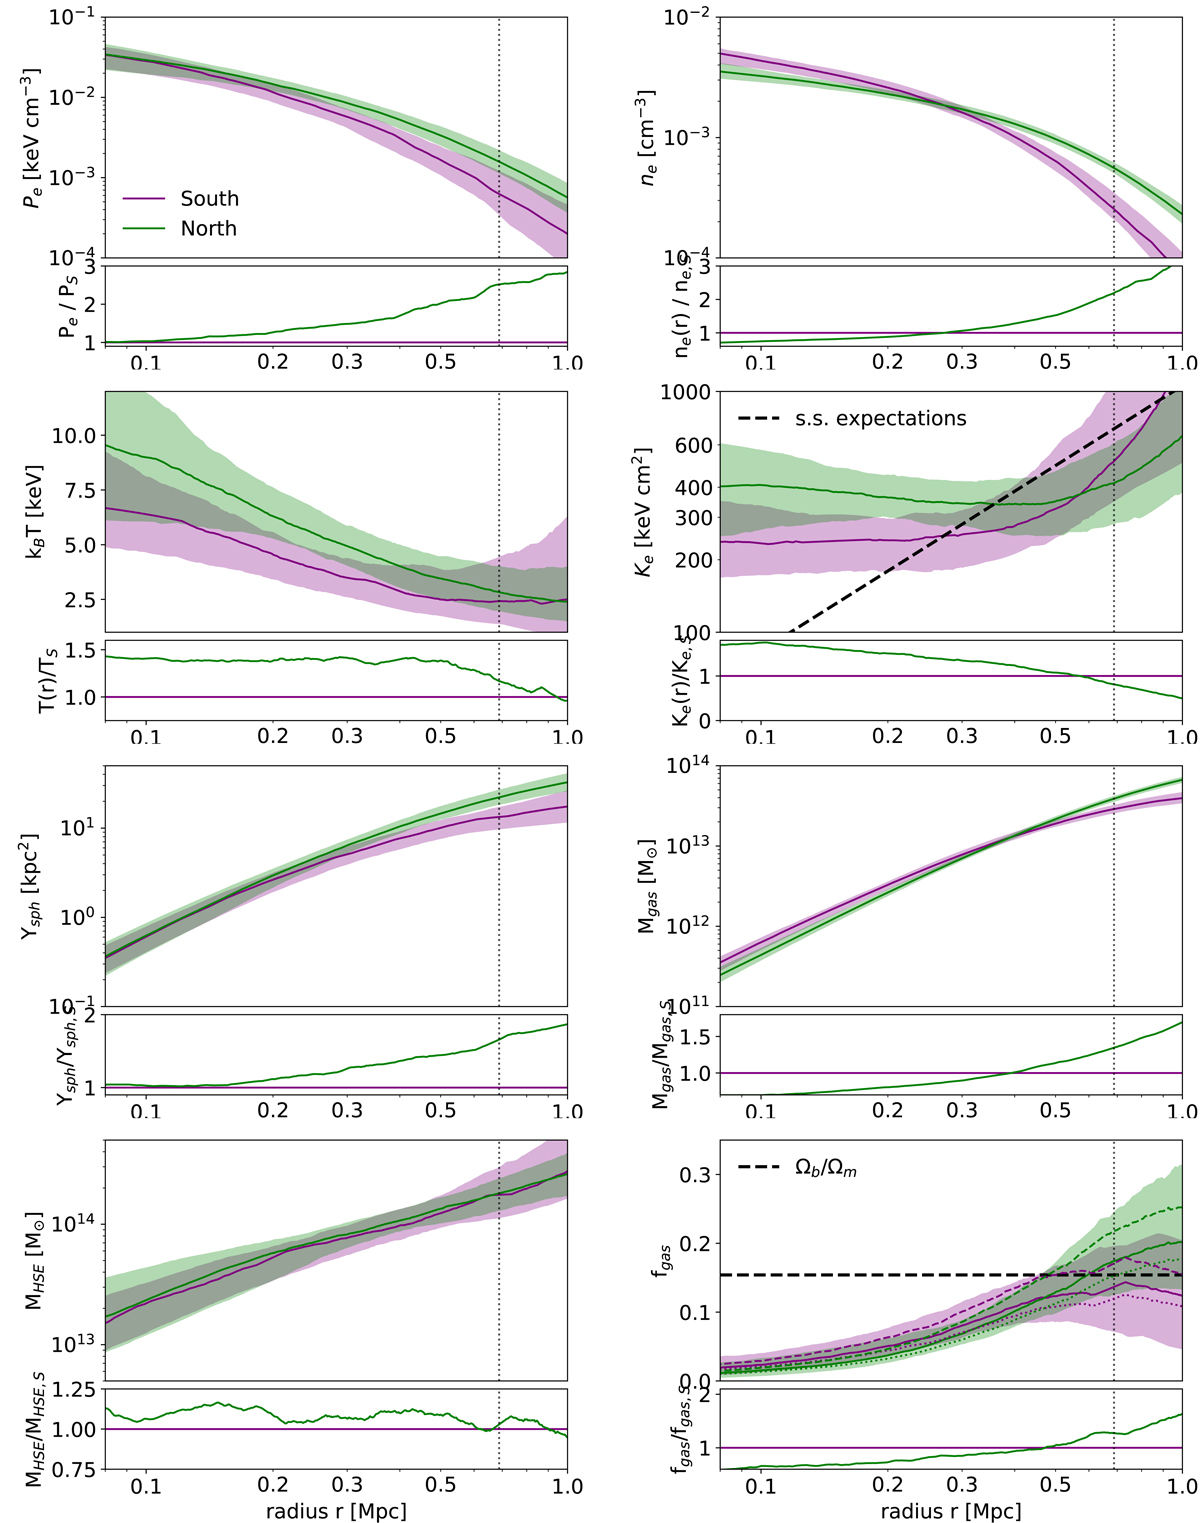
Radial physical profiles of XLSSC 102 computed in the northern region (green) and the southern region (purple). The legend is the same as in Fig. 8. The bottom inset panel in each plot shows the ratio of the profiles computed in the northern and southern regions. This sentence is here to overpass a bug in latex.
Current usage metrics show cumulative count of Article Views (full-text article views including HTML views, PDF and ePub downloads, according to the available data) and Abstracts Views on Vision4Press platform.
Data correspond to usage on the plateform after 2015. The current usage metrics is available 48-96 hours after online publication and is updated daily on week days.
Initial download of the metrics may take a while.