Fig. 8.
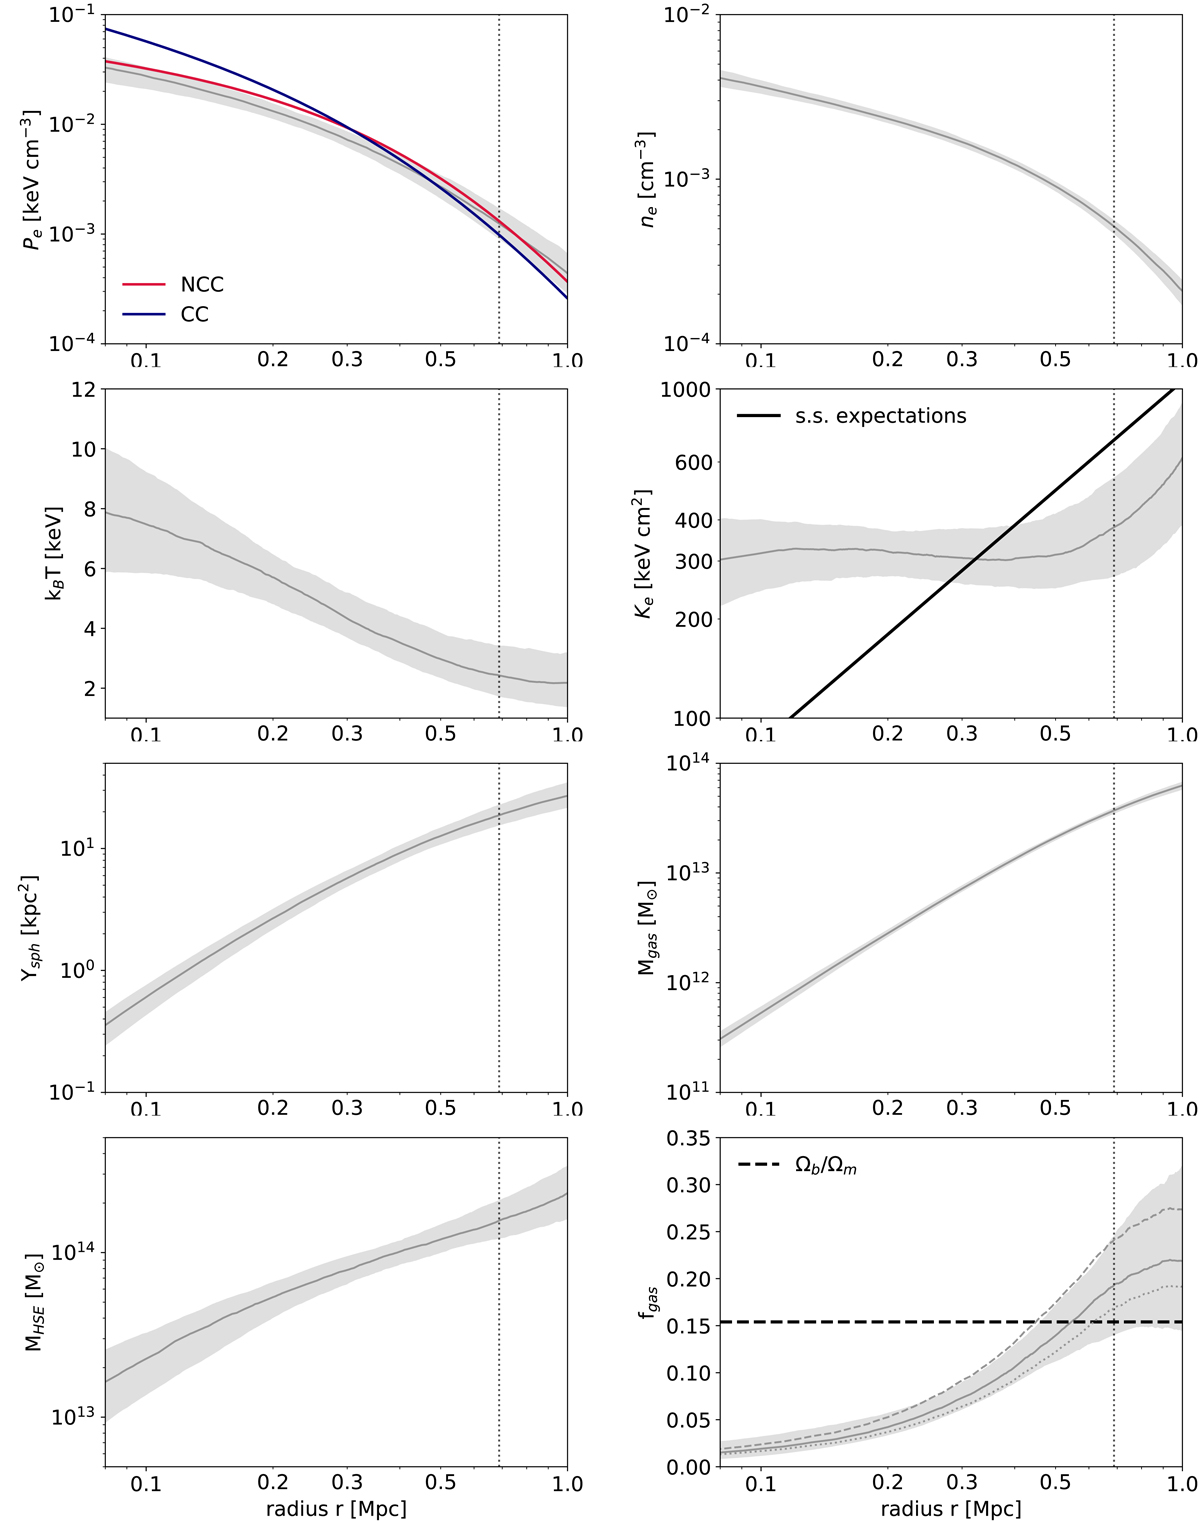
Radial physical profiles of XLSSC 102. From left to right and top to bottom: electron pressure, electron density, temperature, electron entropy index, spherically integrated SZ flux, gas mass, hydrostatic mass, and gas fraction profiles. The grey shaded regions shows 68% c.i. around the median profiles. The thin dotted black line indicates the value of r500 from XXL. For comparison, the mean pressure profiles of cool core and disturbed clusters from the REXCESS sample (Arnaud et al. 2010, hereafter, A10), computed with the mass estimated from XXL scaling relations ![]() (see Table 1), are shown by the dark blue and red curves. The self-similar entropy index expectation from Voit (2005) computed for a mass
(see Table 1), are shown by the dark blue and red curves. The self-similar entropy index expectation from Voit (2005) computed for a mass ![]() (see Table 1) and the value of the cosmic gas fraction are shown by the dashed black lines. The latter is computed as
(see Table 1) and the value of the cosmic gas fraction are shown by the dashed black lines. The latter is computed as ![]() under the assumption that all the baryons are in the hot gas phase, with baryonic and matter density taken from Planck Collaboration VI (2020). The gas fraction profile is computed assuming bHSE = 0.2. The median profiles computed assuming bHSE = 0 and bHSE = 0.3 are shown by the dotted and dashed grey curves respectively.
under the assumption that all the baryons are in the hot gas phase, with baryonic and matter density taken from Planck Collaboration VI (2020). The gas fraction profile is computed assuming bHSE = 0.2. The median profiles computed assuming bHSE = 0 and bHSE = 0.3 are shown by the dotted and dashed grey curves respectively.
Current usage metrics show cumulative count of Article Views (full-text article views including HTML views, PDF and ePub downloads, according to the available data) and Abstracts Views on Vision4Press platform.
Data correspond to usage on the plateform after 2015. The current usage metrics is available 48-96 hours after online publication and is updated daily on week days.
Initial download of the metrics may take a while.