Fig. 7.
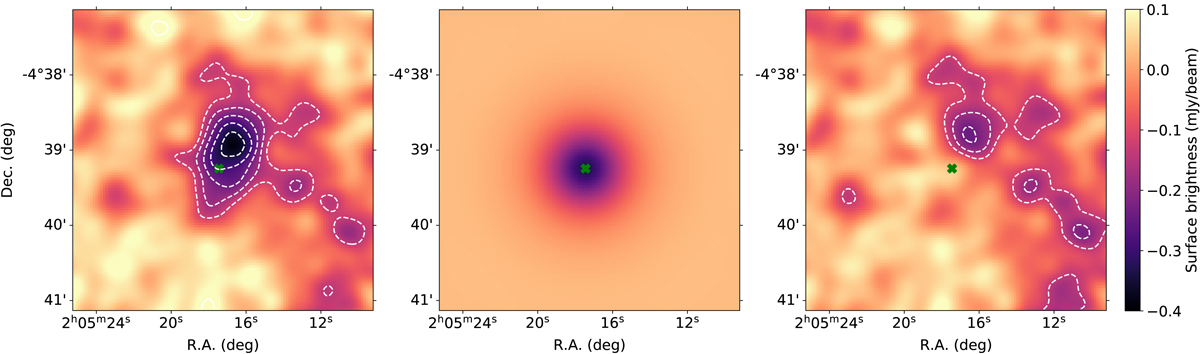
Comparison between the NIKA2 data and the best-fit model evaluated at the X-ray peak (green cross). Left: input SZ map. Middle: maximum likelihood model map. Right: residuals. The white contours indicate the S/N levels, starting at S/N = 2 and linearly increasing by step of one. The green crosses indicate the position chosen as the centre of the model (here, the X-ray peak).
Current usage metrics show cumulative count of Article Views (full-text article views including HTML views, PDF and ePub downloads, according to the available data) and Abstracts Views on Vision4Press platform.
Data correspond to usage on the plateform after 2015. The current usage metrics is available 48-96 hours after online publication and is updated daily on week days.
Initial download of the metrics may take a while.