Fig. 6.
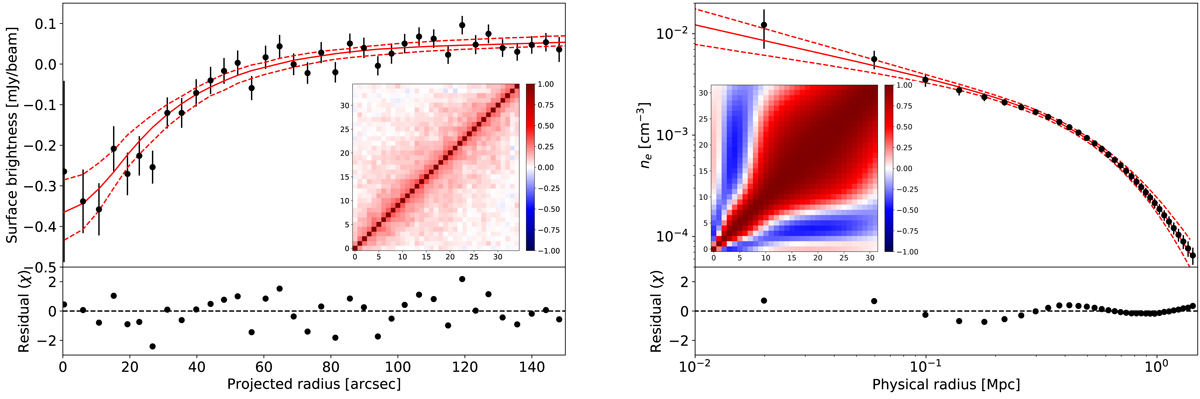
SZ and X-ray visualisation of the input data for the combined analysis. The maximum likelihood model profiles and their 68% confidence intervals are shown by the red lines, and the bottom plots show the residuals. The error bars indicate the 68% c.i., but they only represent the diagonal of the covariance matrix as errors are correlated. The bin-to-bin error correlation matrices are shown by the inset figure in each plot. Left: SZ surface brightness profile as a function of projected radius, centred on the X-ray peak position. The black points show the inverse variance weighted mean surface brightness in each annulus. The slightly positive value at large projected radius is due to the unconstrained zero level of the map. As detailed in the text, in practice we use the map and not just the profile. Right: de-projected X-ray electron density profile, centred on the X-ray peak position. The errors in each bin are highly correlated because of the de-projection scheme.
Current usage metrics show cumulative count of Article Views (full-text article views including HTML views, PDF and ePub downloads, according to the available data) and Abstracts Views on Vision4Press platform.
Data correspond to usage on the plateform after 2015. The current usage metrics is available 48-96 hours after online publication and is updated daily on week days.
Initial download of the metrics may take a while.