Fig. 5.
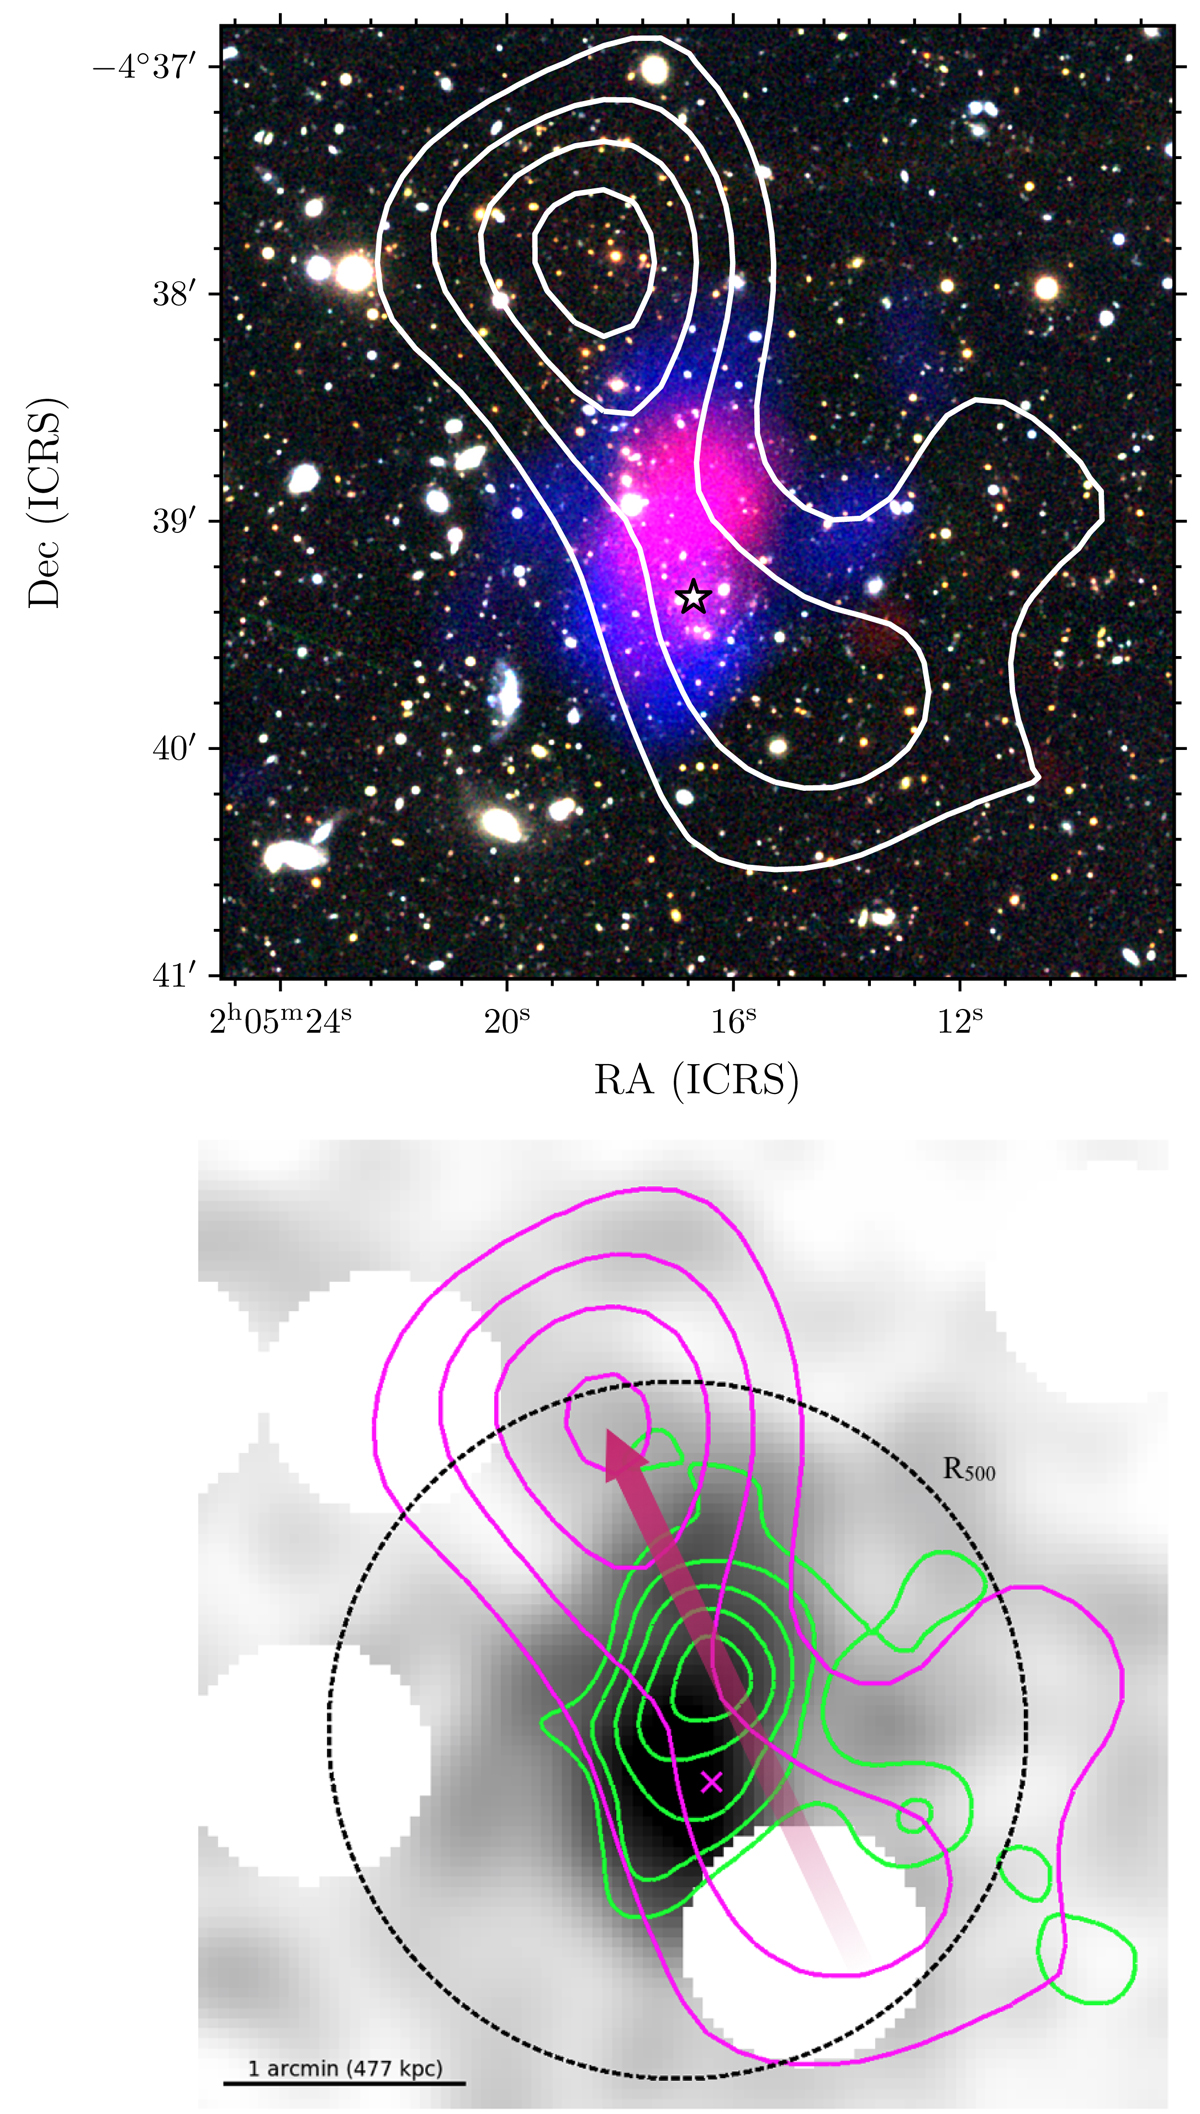
Multi-wavelength view of XLSSC 102. Top: composite image of XLSSC 102. The background optical image is as in the right panel of Fig. 2, the SZ signal is shown in red and the X-ray signal is shown in blue. The BCG position is indicated by the black star. Bottom: SZ S/N contours are over-plotted in green and the galaxy isodensity S/B contours are over-plotted in magenta on the X-ray surface brightness map. The smoothing is the same as in Fig. 2. The BCG position is shown by the magenta cross. The scale is indicated by the black line and the radius r500 is given by the black dashed circle. The pink arrow represents the possible merger axis.
Current usage metrics show cumulative count of Article Views (full-text article views including HTML views, PDF and ePub downloads, according to the available data) and Abstracts Views on Vision4Press platform.
Data correspond to usage on the plateform after 2015. The current usage metrics is available 48-96 hours after online publication and is updated daily on week days.
Initial download of the metrics may take a while.