Fig. 4.
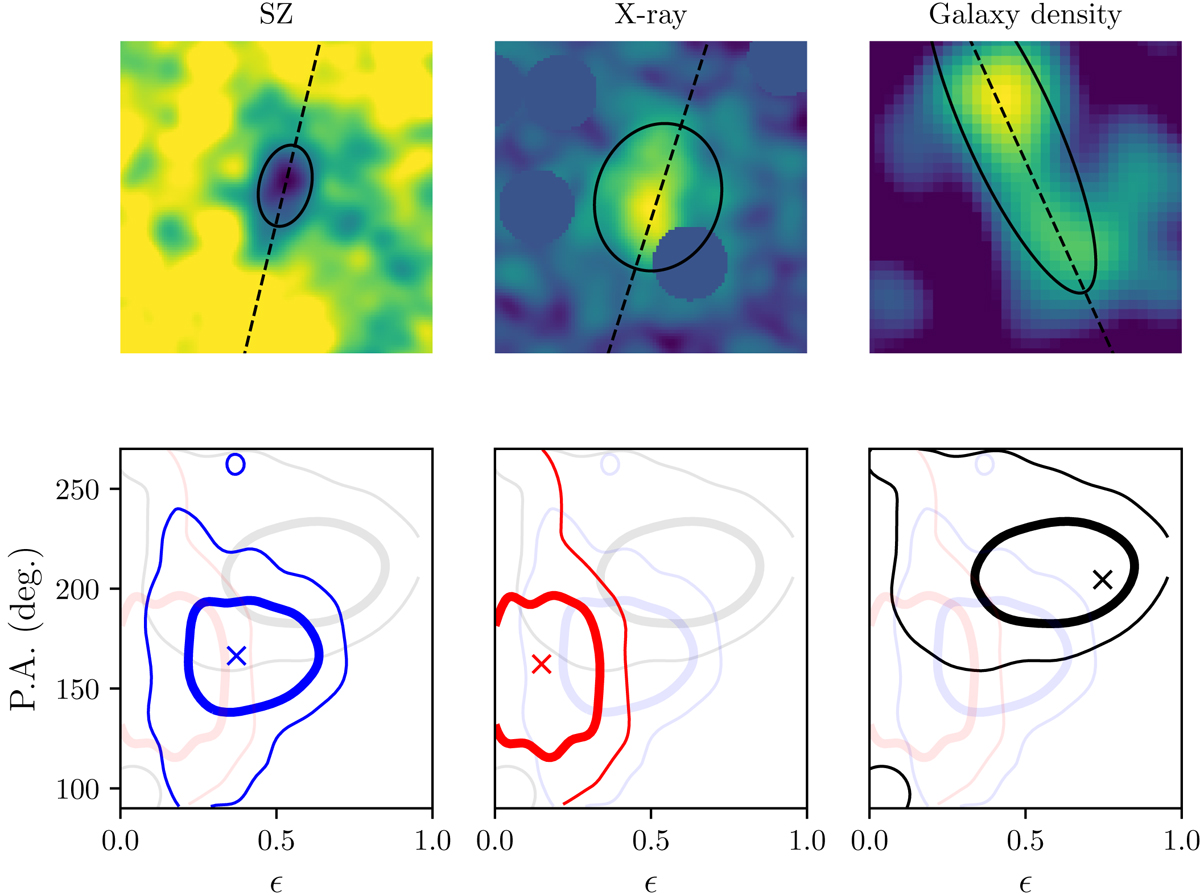
Upper panel: best 2D Gaussian fit over-plotted on the SZ map (left), the X-ray surface brightness map (middle) and the optical over-density map (right). The position of the major axis is indicated by the dashed line. The sizes of the ellipses correspond to the 2D Gaussian FWHM. Bottom panel: confidence contours of the position angle and ellipticities, for the SZ image (left, blue), the X-ray map (middle, red) and the galaxy density (right, black). The crosses indicate the best-fit parameters.
Current usage metrics show cumulative count of Article Views (full-text article views including HTML views, PDF and ePub downloads, according to the available data) and Abstracts Views on Vision4Press platform.
Data correspond to usage on the plateform after 2015. The current usage metrics is available 48-96 hours after online publication and is updated daily on week days.
Initial download of the metrics may take a while.