Fig. 2.
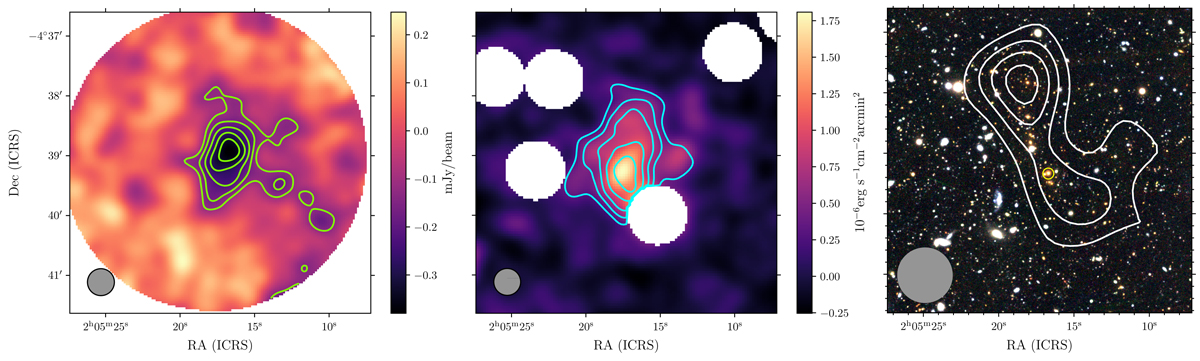
Multi-wavelength view of XLSSC 102. The size of the images is 2.4 × 2.4 Mpc2 and the S/N contours start at S/N = 2 and increase by step of one (left and middle) and two (right). The maps are smoothed to an effective resolution of 27 arcsec (left, middle) and 54 arcsec (right), as indicated by the circles on the bottom left corners. The projection of the maps is given in the international celestial reference system (ICRS). Left: map in the 150 GHz NIKA2 band. The S/N contours are shown in green. We masked the regions where the noise is higher than 25% with respect to the centre. Middle: surface brightness map in the [0.5–2] keV XMM-Newton band. The S/N contours are shown in cyan and the masked white regions correspond to AGN. Right: composite optical image of XLSSC 102 made of Hyper Suprime-Cam images taken in the R, I and Z filters. The galaxy density map S/B contours are over-plotted in white and the BCG is indicated by the yellow circle.
Current usage metrics show cumulative count of Article Views (full-text article views including HTML views, PDF and ePub downloads, according to the available data) and Abstracts Views on Vision4Press platform.
Data correspond to usage on the plateform after 2015. The current usage metrics is available 48-96 hours after online publication and is updated daily on week days.
Initial download of the metrics may take a while.