Fig. 13.
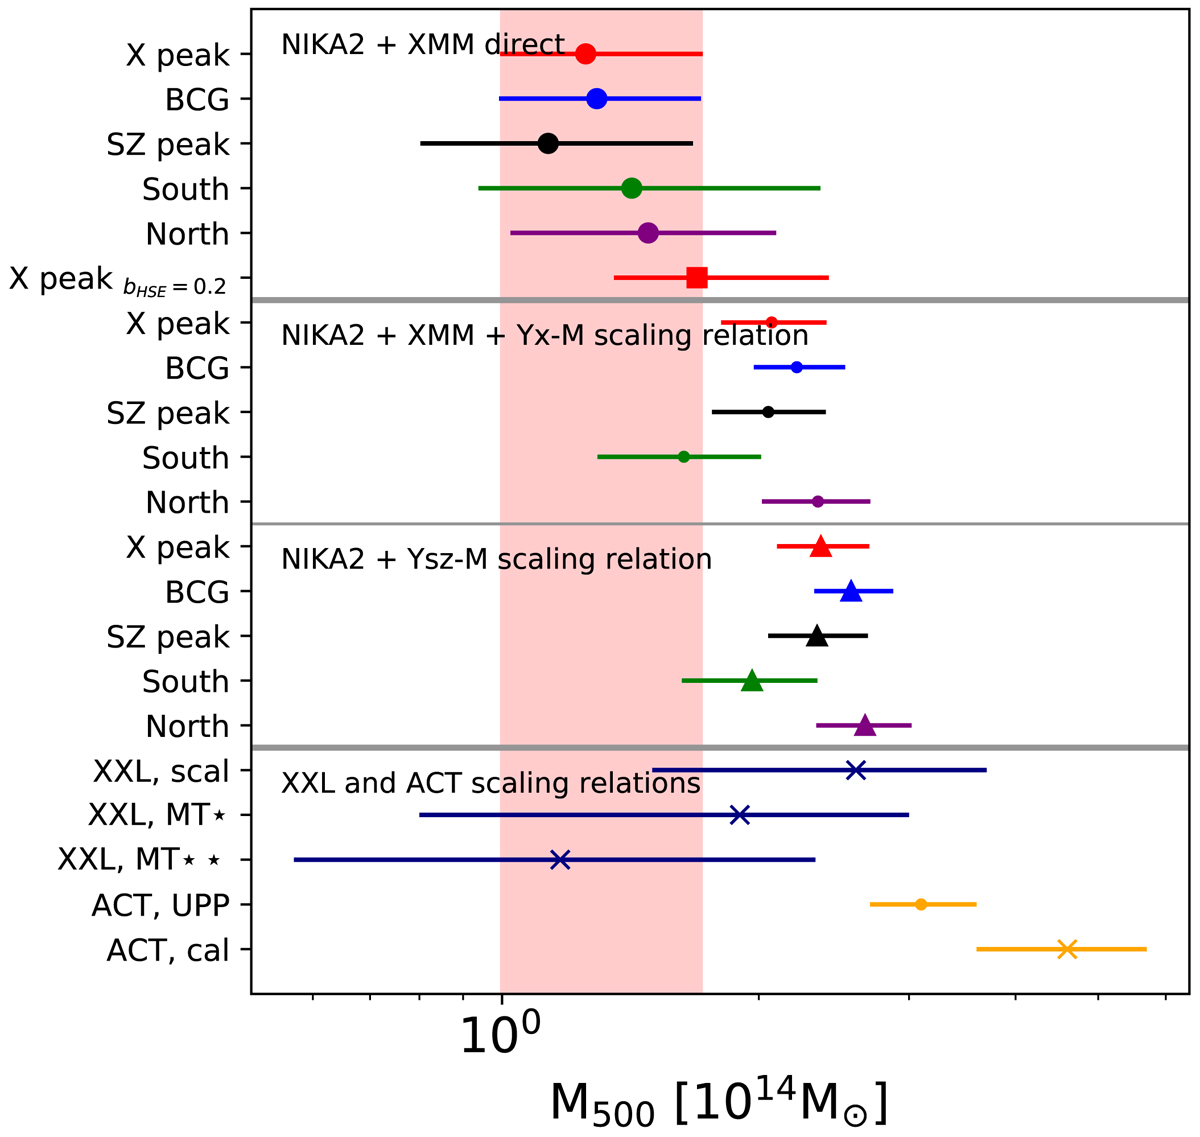
Comparison of the different estimates of M500 of XLSSC 102. Top part: direct measurements from the hydrostatic mass profiles, derived from the combination of NIKA2 and XMM data. Middle part: mass estimates derived from the measurements of YX(R) and the scaling relation from A10 (dots), and from the measurements of YSZ(R) and the scaling relation from Planck XX (triangles). All points and error bars indicate the median and 68% c.i. around it. Bottom part: mass estimation from the XXL survey and from the ACT survey (see Table 1 and text). The crosses indicate mass estimates derived from weak lensing calibrated scaling laws. The pink stripe indicates, for visual reference, the 68% c.i. around M500 measured from the combination of NIKA2 and XMM data, using the X-ray peak and assuming bHSE = 0.
Current usage metrics show cumulative count of Article Views (full-text article views including HTML views, PDF and ePub downloads, according to the available data) and Abstracts Views on Vision4Press platform.
Data correspond to usage on the plateform after 2015. The current usage metrics is available 48-96 hours after online publication and is updated daily on week days.
Initial download of the metrics may take a while.