Fig. 12.
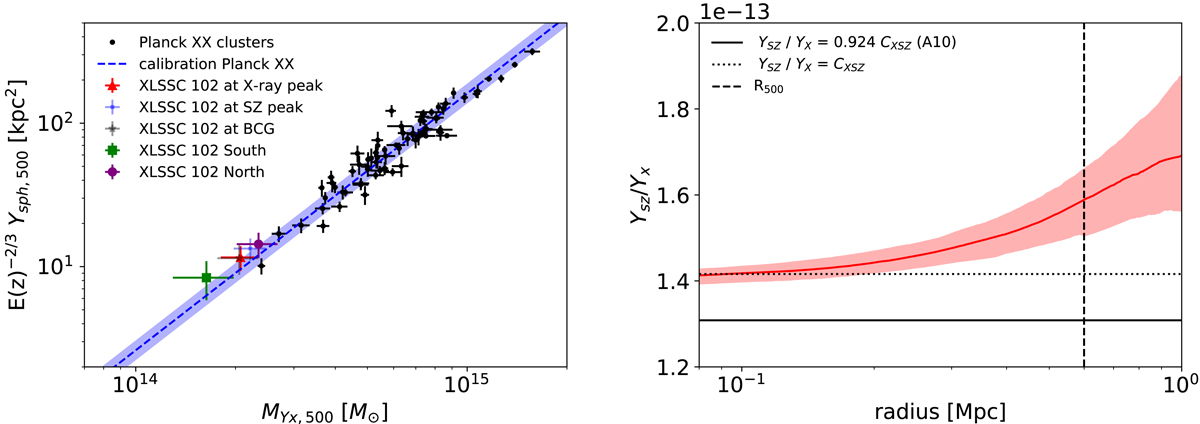
Left: location of XLSSC 102 on the scaling relation between the spherically integrated Compton parameter Y500 and the mass proxy MYX, 500. The legend is the same as in Fig. 11. Masses are estimated via the YX profile and the YX, 500 − MYX, 500 from A10. As explained in Planck XX, the scaling relations between Y500 and MHSE, 500 or MYX, 500 are the same and only the uncertainties and intrinsic scatter change. Right: ratio of the spherically integrated Compton parameter YSZ to its X-ray analogue YX, computed using the X-ray peak. Here YX is computed using the temperature estimated from the combination of SZ and X-ray data. The solid black line shows the calibration from A10 and the dotted line indicates the value for an isothermal cluster. The dashed black line marks 0.6 Mpc, which is close to the r500 values found in Sect. 5.1.
Current usage metrics show cumulative count of Article Views (full-text article views including HTML views, PDF and ePub downloads, according to the available data) and Abstracts Views on Vision4Press platform.
Data correspond to usage on the plateform after 2015. The current usage metrics is available 48-96 hours after online publication and is updated daily on week days.
Initial download of the metrics may take a while.