Fig. 11.
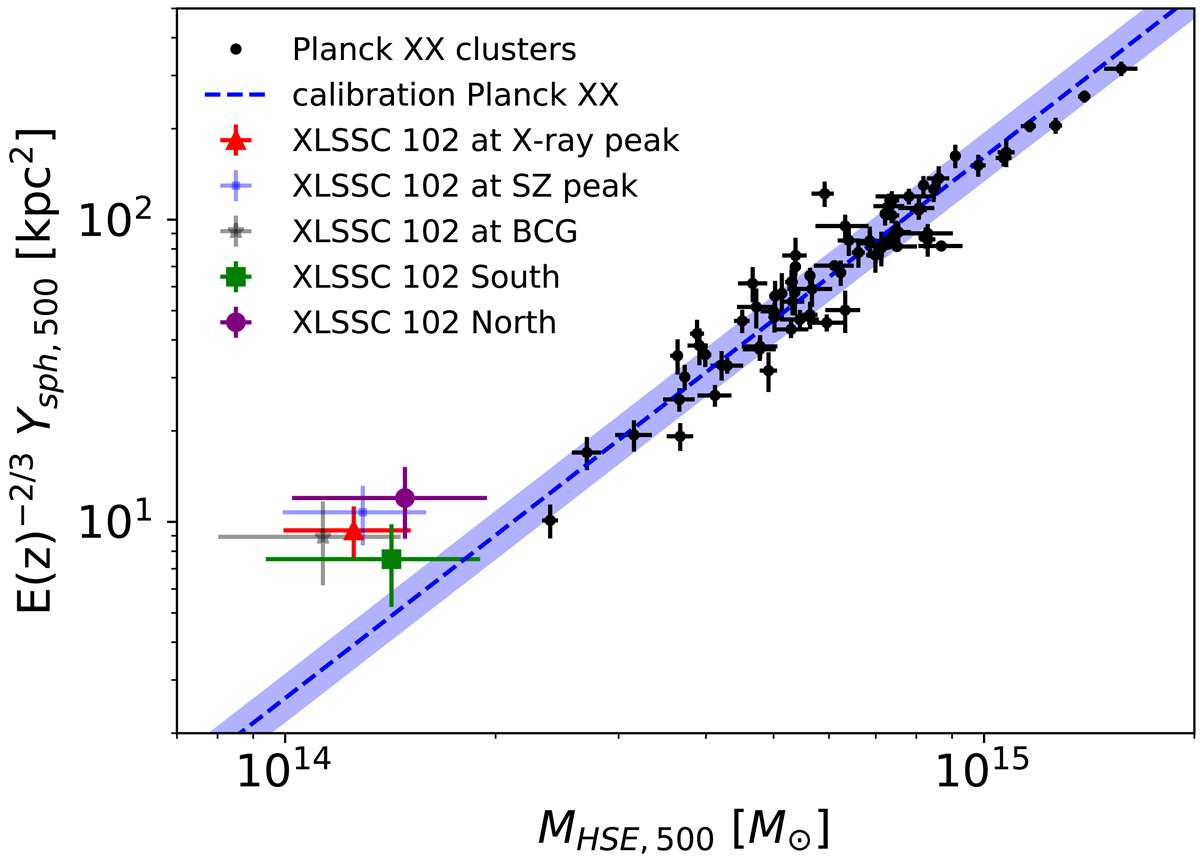
Location of XLSSC 102 on the scaling relation between the spherically integrated Compton parameter Y500 and the hydrostatic mass MHSE, 500 (i.e. the total mass assuming bHSE = 0). The different markers indicate the values from the combined SZ+X-ray analysis of XLSSC 102 evaluated on the entire cluster at different centres and from the southern and northern regions at the X-ray centre, as indicated in the legend. The values and error bars represent the median and the 68% c.i. The black data points show the Planck calibration cluster sample corrected from Malmquist bias. The blue line and region indicate the fitted relation and its intrinsic scatter (Planck XX).
Current usage metrics show cumulative count of Article Views (full-text article views including HTML views, PDF and ePub downloads, according to the available data) and Abstracts Views on Vision4Press platform.
Data correspond to usage on the plateform after 2015. The current usage metrics is available 48-96 hours after online publication and is updated daily on week days.
Initial download of the metrics may take a while.