Fig. 1.
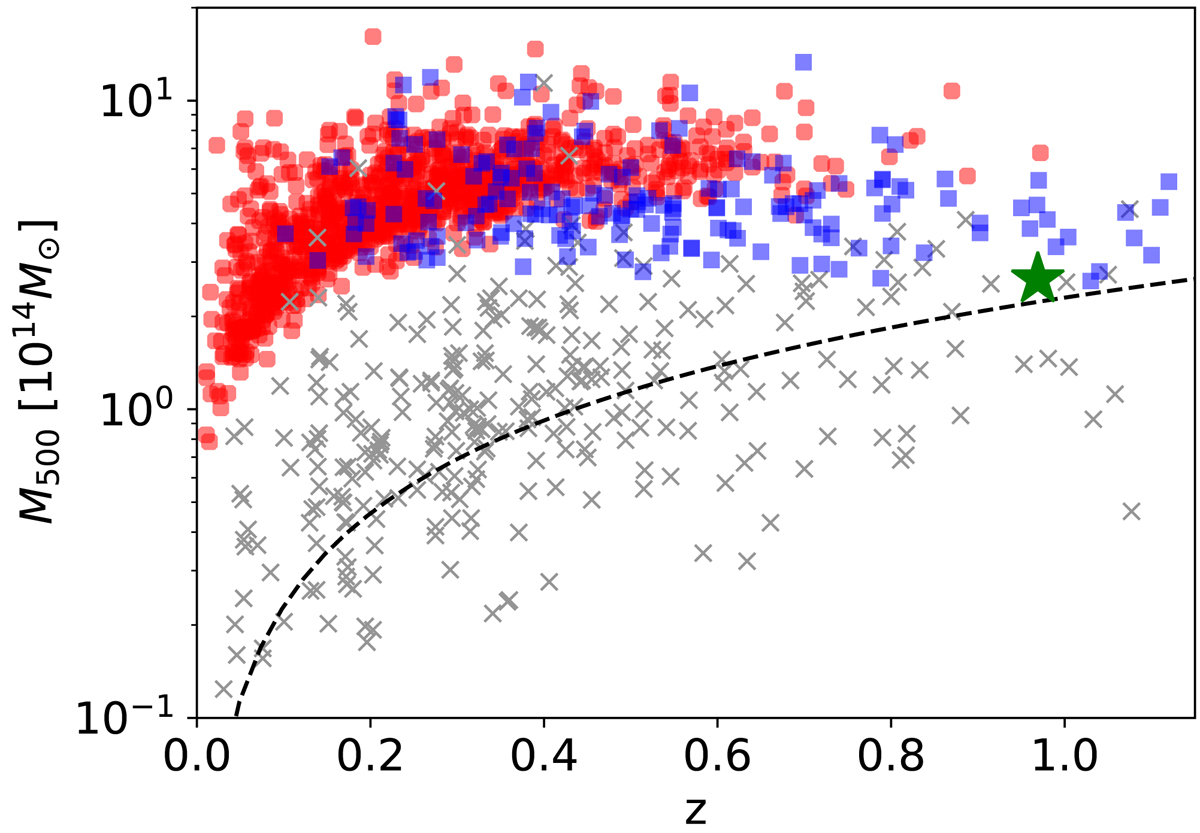
Location of XLSSC 102 (indicated by the green star) in the mass-redshift plane, and comparison to the distribution of X-ray and SZ cluster samples. The C1 and C2 XXL clusters with spectroscopic redshift measurements XXL Paper XX are shown by the grey crosses. Their masses are derived from internal scaling relations (M500, scal). The Planck SZ sample (Planck Collaboration XXVII 2016) and the ACT sample (Hilton et al. 2018) are shown by the red circles and the blue squares, respectively. The dashed line indicates the expected eROSITA limiting mass corresponding to a detection limit of 50 photons in the 0.5–2.0 keV band and an exposure time of 1.6 ks (see Bocquet et al. 2016).
Current usage metrics show cumulative count of Article Views (full-text article views including HTML views, PDF and ePub downloads, according to the available data) and Abstracts Views on Vision4Press platform.
Data correspond to usage on the plateform after 2015. The current usage metrics is available 48-96 hours after online publication and is updated daily on week days.
Initial download of the metrics may take a while.