Fig. 6
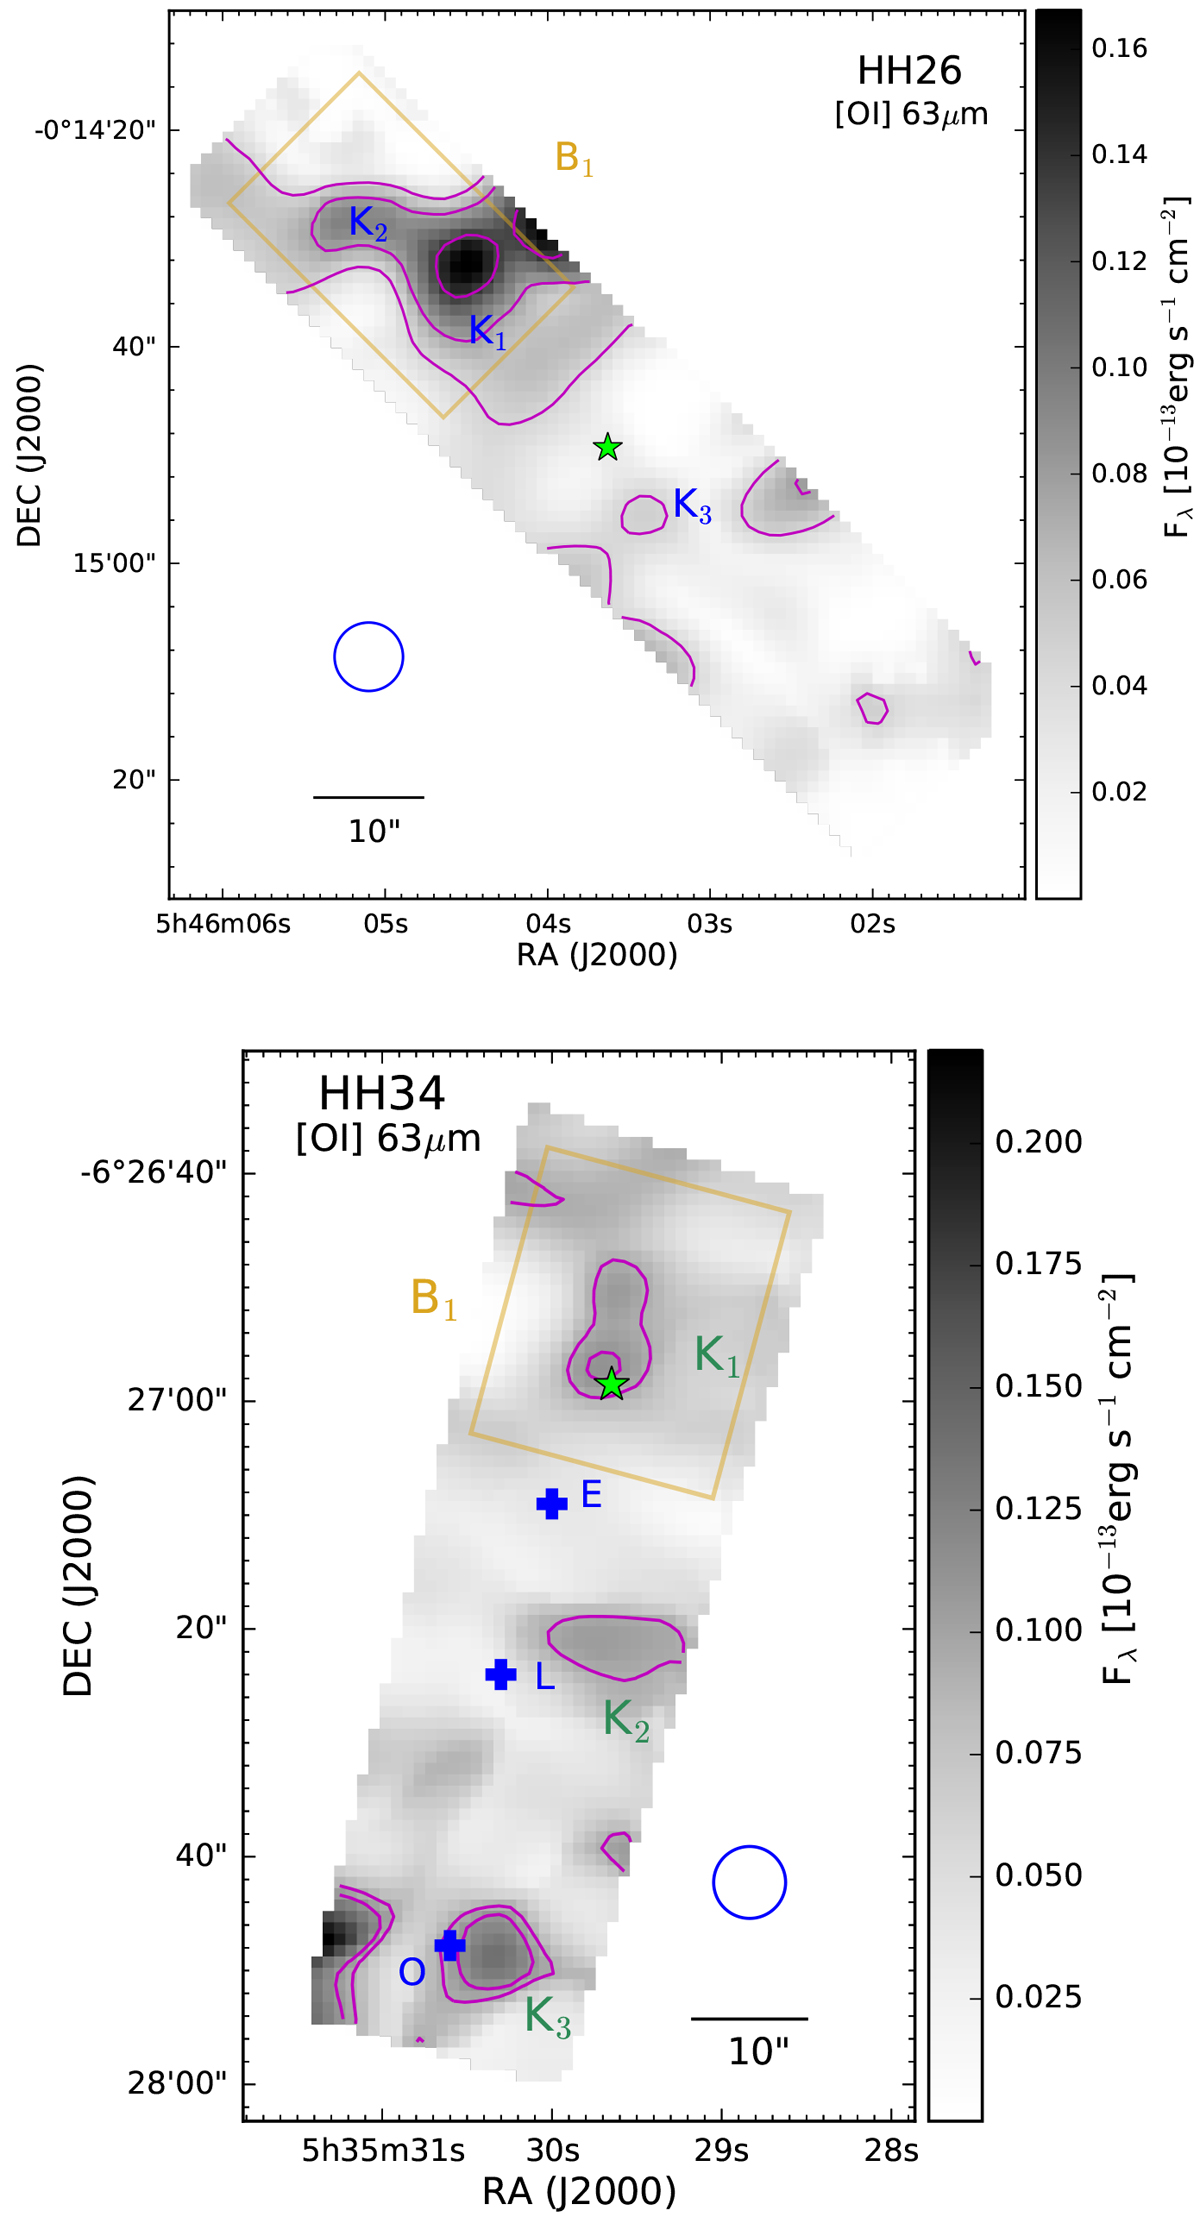
Continuum-subtracted [O I]63 maps of HH26 and HH34. The light green stars indicate the position of the jet driving sources HH26IRS, HH34IRS, and HH30IRS (coordinates from Table 1). The blue circle shows the FWHM spatial beam size in the blue channel of the FIFI-LS instrument. The golden boxes are the boundaries of the rectangular apertures, in which the fluxes F63μm and F145μm are measured (Table 4). Top panel: contour lines are drawn in magenta in logarithmic scale at three levels between (0.052–0.142) × 10−13 erg s−1 cm−2. Bottom panel: blue crosses label the position of the two knots E and L (between them lies the optical jet) and knot O (Heathcote & Reipurth 1992). Contour lines are drawn in magenta at two levels (0.105–0.125) × 10−13 erg s−1 cm−2.
Current usage metrics show cumulative count of Article Views (full-text article views including HTML views, PDF and ePub downloads, according to the available data) and Abstracts Views on Vision4Press platform.
Data correspond to usage on the plateform after 2015. The current usage metrics is available 48-96 hours after online publication and is updated daily on week days.
Initial download of the metrics may take a while.