Fig. 5
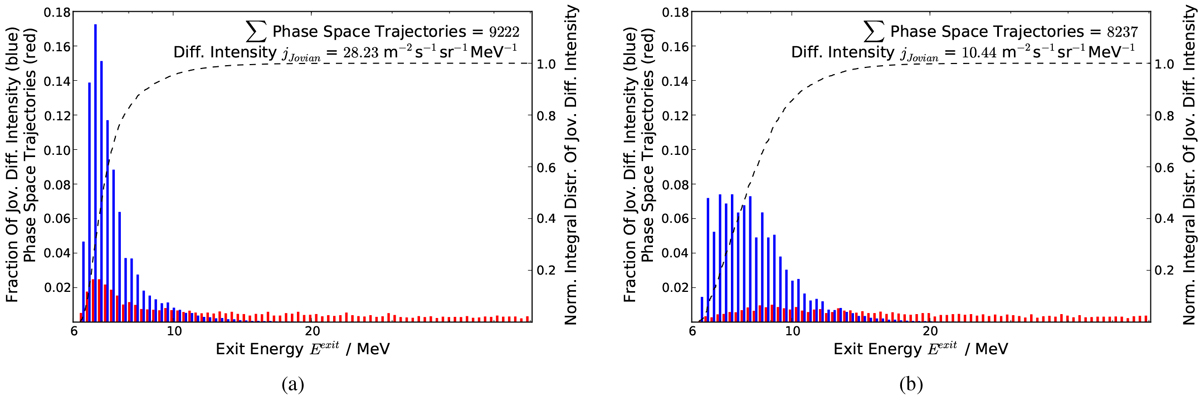
Binned distributions of the exit energies ![]() (red) and the binned contribution of each energy point to the total differential intensity,
(red) and the binned contribution of each energy point to the total differential intensity,
![]() (blue), for an initial energy of
(blue), for an initial energy of ![]() MeV. Thereby panel a shows the distribution of exit times of pseudo-particles for a good magnetic connection between the observational point and the Jovian source and panel b for the case of poor magnetic connection. The dashed lines show the integral distribution of the trajectories’ contribution to the total differential intensity as shown in blue.
MeV. Thereby panel a shows the distribution of exit times of pseudo-particles for a good magnetic connection between the observational point and the Jovian source and panel b for the case of poor magnetic connection. The dashed lines show the integral distribution of the trajectories’ contribution to the total differential intensity as shown in blue.
Current usage metrics show cumulative count of Article Views (full-text article views including HTML views, PDF and ePub downloads, according to the available data) and Abstracts Views on Vision4Press platform.
Data correspond to usage on the plateform after 2015. The current usage metrics is available 48-96 hours after online publication and is updated daily on week days.
Initial download of the metrics may take a while.