Fig. 4
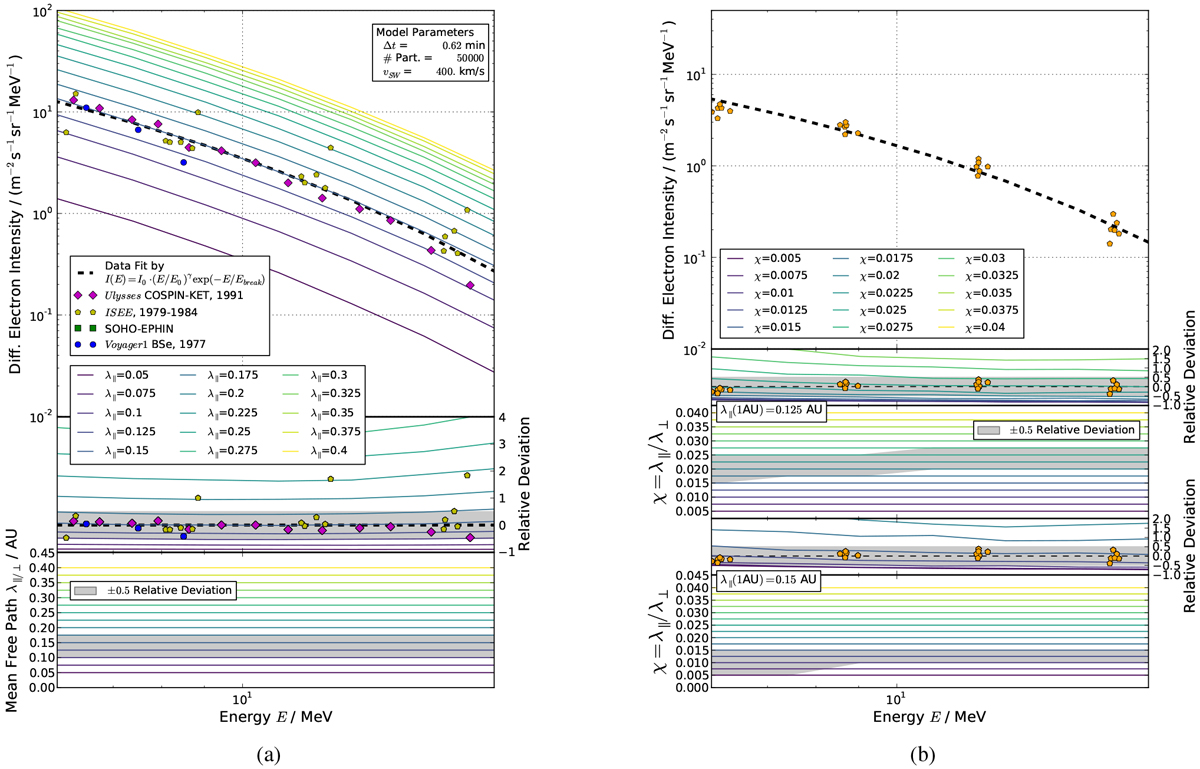
Simulated Jovian electron spectra used to optimize the values of λ∥ and χ. Top panel:a data fit (dashed line) along with the simulations results and spacecraft data obtained during corresponding time periods at the longitudinal point of best effective magnetic connection for different values of λ∥ = [0.05, 0.4] AU. Panel b does not show the simulated spectra for different values of for different values of χ = [0.005, 0.045] in the upper panel as the simulations are performed utilizing two different values for λ∥. The fit (dashed line) was performed utilizing spacecraft data by ISEE 3, the only spectral data formagnetically poorly connected observation times as given by Table 1. Lower panels: corresponding relative deviations from the fit (dashed lines) together with the ± 0.5 deviation area given in shaded grey and the spacecraft data. Lowest panel: shaded area marks the range of values for λ∥∕⊥ within the margin of less than ± 0.5 relative deviation.
Current usage metrics show cumulative count of Article Views (full-text article views including HTML views, PDF and ePub downloads, according to the available data) and Abstracts Views on Vision4Press platform.
Data correspond to usage on the plateform after 2015. The current usage metrics is available 48-96 hours after online publication and is updated daily on week days.
Initial download of the metrics may take a while.