Fig. 8
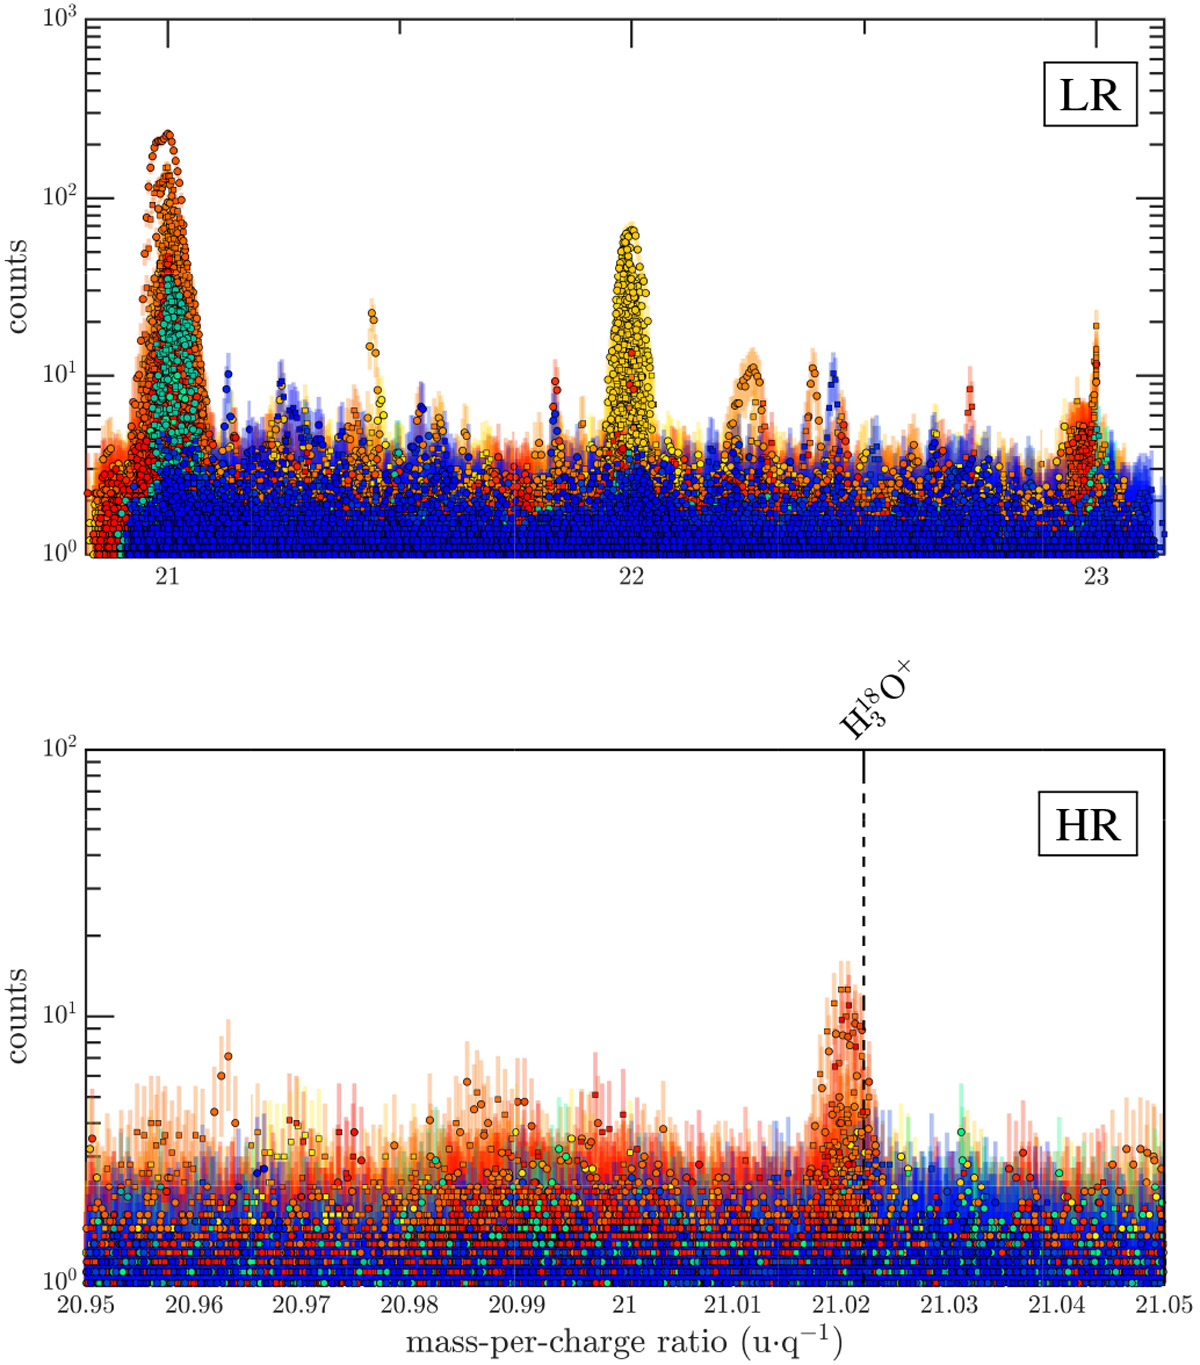
Same as Fig. 3, but for 21–22 u q−1. Stacked spectra in low resolution (top panel) and in HR at 20 u q−1 (bottom). There is no evidence for a species at 22 u q−1 in high resolution and the associated spectra are not shown. In addition, the peak in LR at 23 u q−1 is at the edge of the detector such that it is barely caught on its left edge (see also Fig. 2).
Current usage metrics show cumulative count of Article Views (full-text article views including HTML views, PDF and ePub downloads, according to the available data) and Abstracts Views on Vision4Press platform.
Data correspond to usage on the plateform after 2015. The current usage metrics is available 48-96 hours after online publication and is updated daily on week days.
Initial download of the metrics may take a while.