Fig. 6
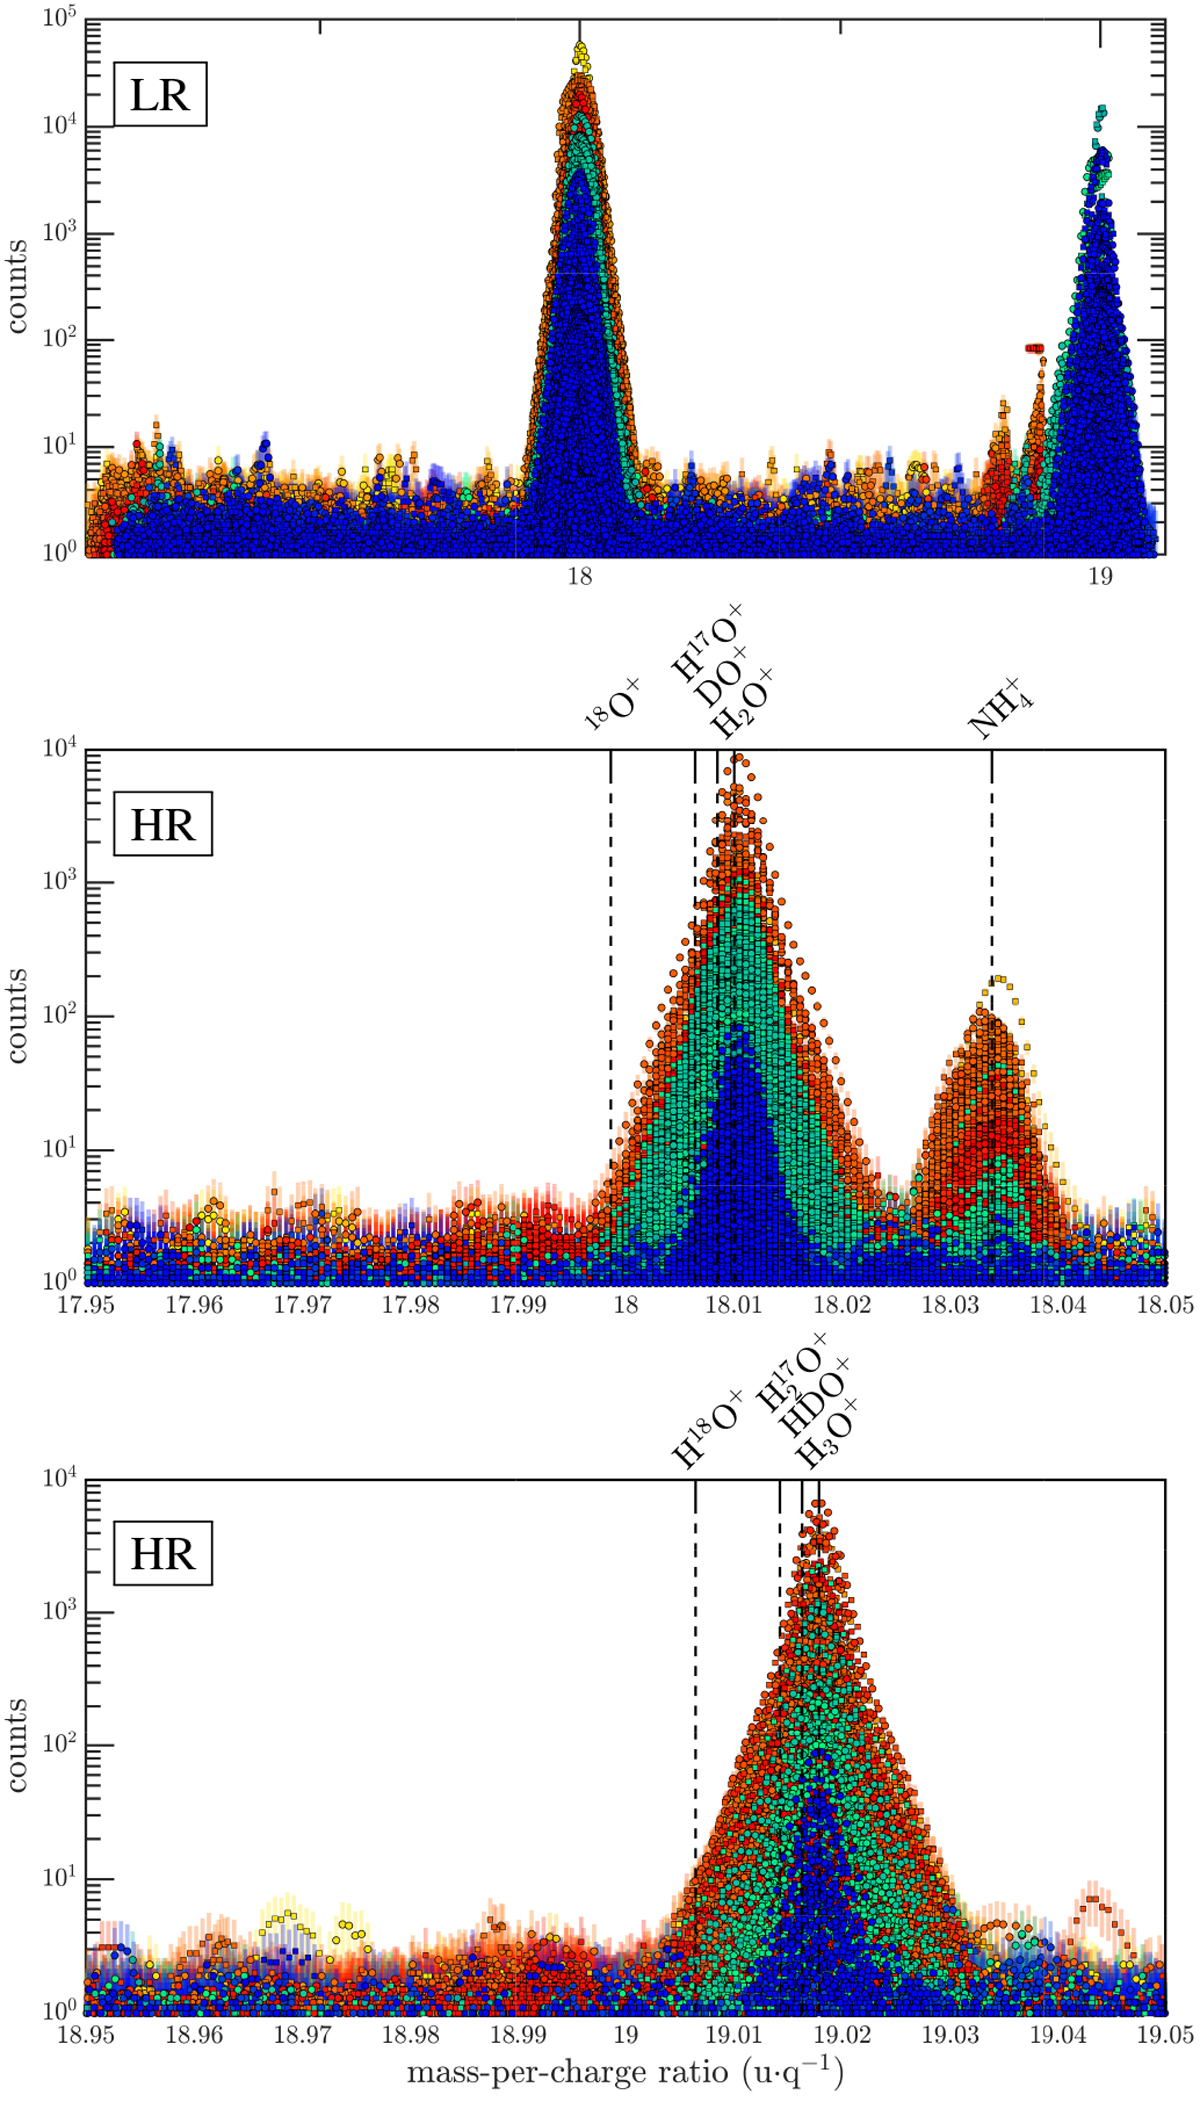
Same as Fig. 3, but for 18–19 u q−1. Stacked spectra in low resolution (top panel) and HR at 18 u q−1 (middle) and 19 u q−1 (bottom). Isotopic ions have been indicated for information. As one may see, the DFMS mass-per-charge resolution cannot separate: neither H17O+ and DO+ from H2O+, nor H2 17O+ and HDO+ from H3O+, and the individual contributions have to be fitted numerically as done in the neutral mode (cf. Altwegg et al. 2015; Schroeder et al. 2019). In addition, the peak in LR at 19 u q−1 is at the edge of the detector such that it is only partially resolved.
Current usage metrics show cumulative count of Article Views (full-text article views including HTML views, PDF and ePub downloads, according to the available data) and Abstracts Views on Vision4Press platform.
Data correspond to usage on the plateform after 2015. The current usage metrics is available 48-96 hours after online publication and is updated daily on week days.
Initial download of the metrics may take a while.