Fig. 3
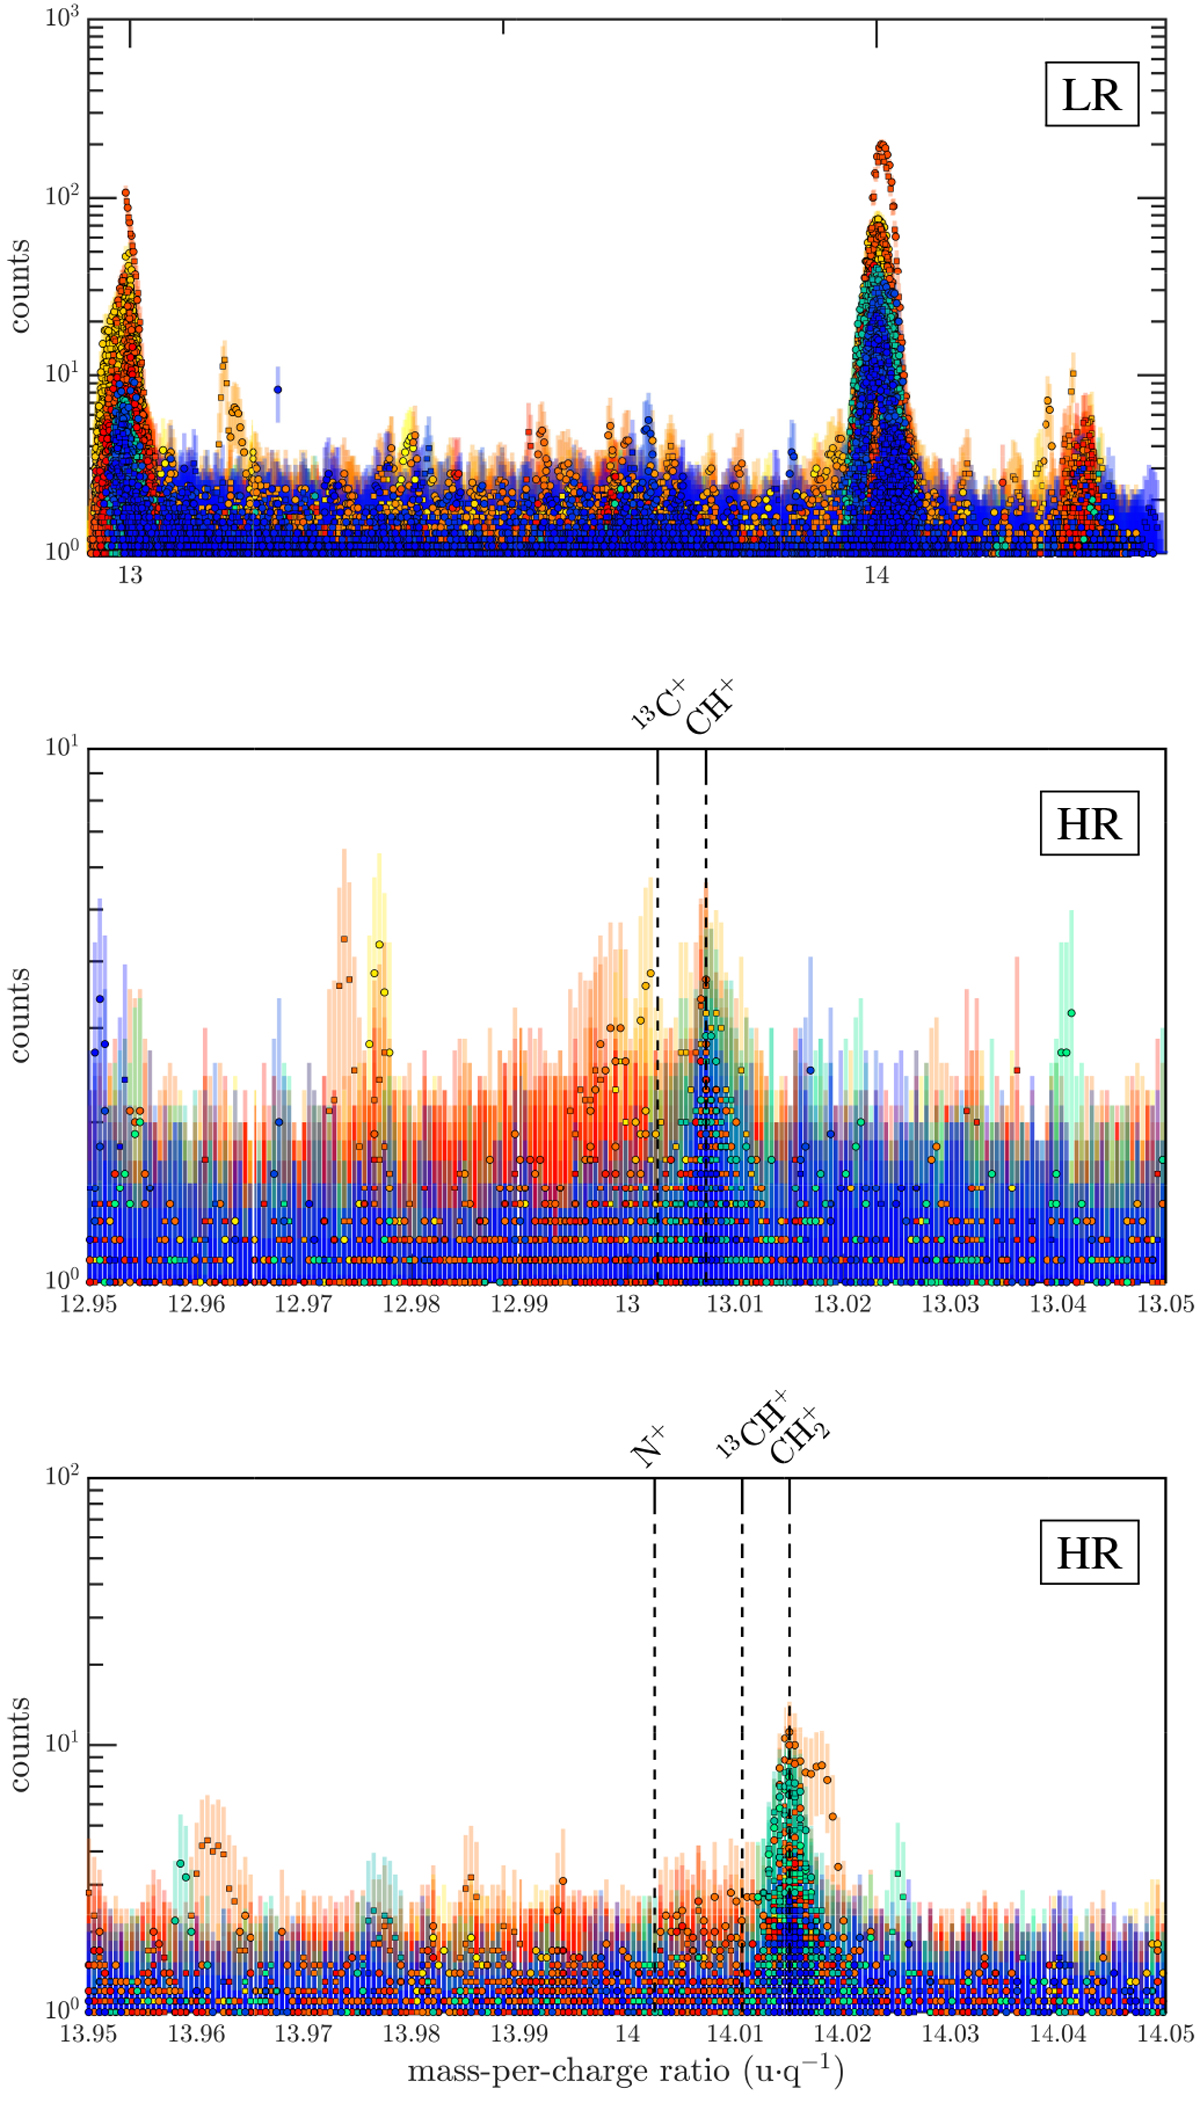
Stacked individual spectra covering 13 and 14 u q−1 from the channel A (○) and channel B (□) of the MCP, each of them represents the accumulated counts during 19.8 s at the maximum gain step. Top panel: stacked spectra in low resolution covering both ranges (mass-per-charge ratios are indicated by the long ticks on the upper axis, half-integer ones by the short ticks). Panels underneath are HR spectra at specific u q−1 : 13 (middle) and 14 (bottom), corrected from the pixel shift (see Fig. A.1). A statistical vertical error bar of ![]() , where N stands for the number of counts, is superimposed to the counts for information. The colour coding is given by the colour bar in Fig. 1 and relies on the time of acquisition during the escort phase. The mass-per-charge ratios of expected ions from Table 1 are also indicated and given in Table C.1.
, where N stands for the number of counts, is superimposed to the counts for information. The colour coding is given by the colour bar in Fig. 1 and relies on the time of acquisition during the escort phase. The mass-per-charge ratios of expected ions from Table 1 are also indicated and given in Table C.1.
Current usage metrics show cumulative count of Article Views (full-text article views including HTML views, PDF and ePub downloads, according to the available data) and Abstracts Views on Vision4Press platform.
Data correspond to usage on the plateform after 2015. The current usage metrics is available 48-96 hours after online publication and is updated daily on week days.
Initial download of the metrics may take a while.