Fig. 2
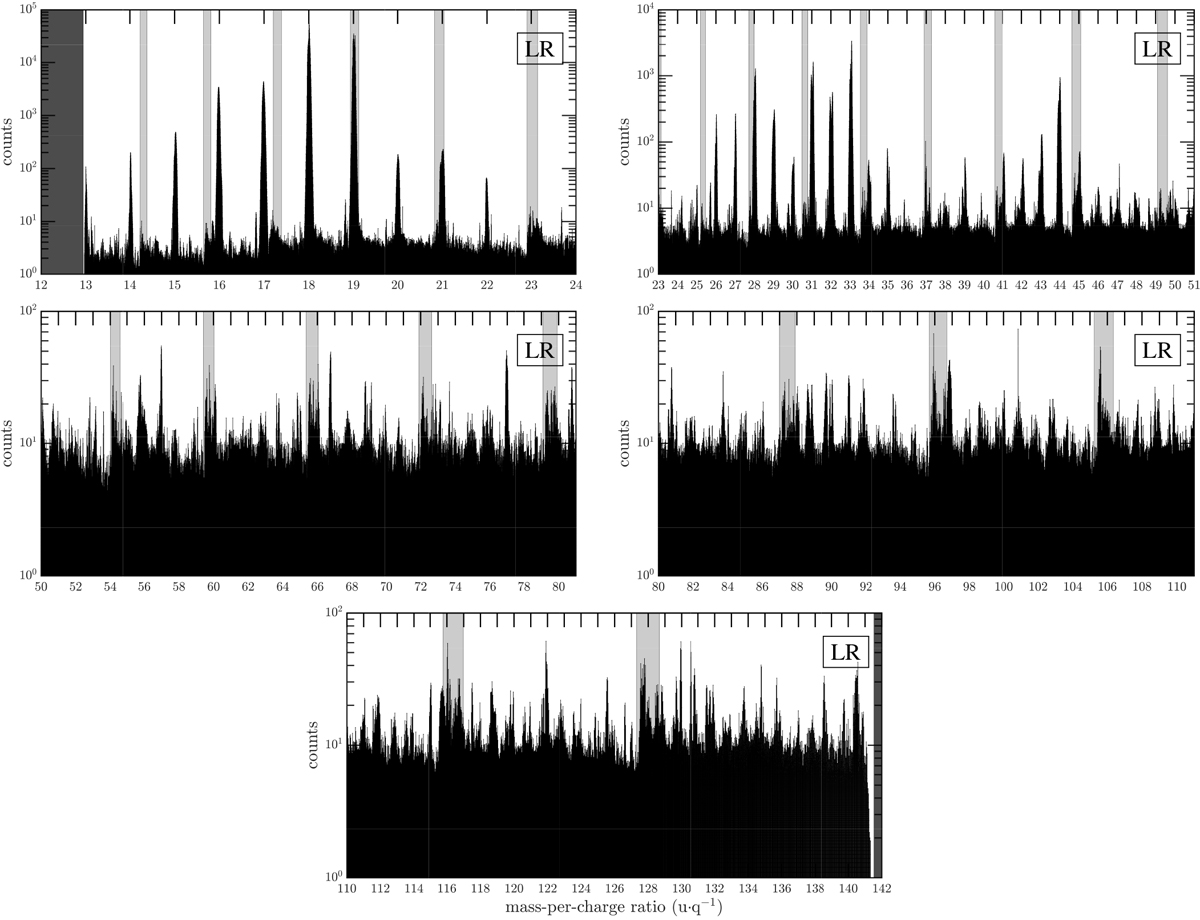
Concatenation of spectra recorded at each channel in ion low resolution mode. This covers mass-per-charge ranging from 13 to 141 u q−1. Dark grey regions represent ranges which are not covered by the instrument (below 13 u q−1 and above 141 u q−1). Light grey regions represent ranges where two consecutive scans overlap, meaning that these ranges are covered by the edge of the detector.
Current usage metrics show cumulative count of Article Views (full-text article views including HTML views, PDF and ePub downloads, according to the available data) and Abstracts Views on Vision4Press platform.
Data correspond to usage on the plateform after 2015. The current usage metrics is available 48-96 hours after online publication and is updated daily on week days.
Initial download of the metrics may take a while.