Fig. A.1
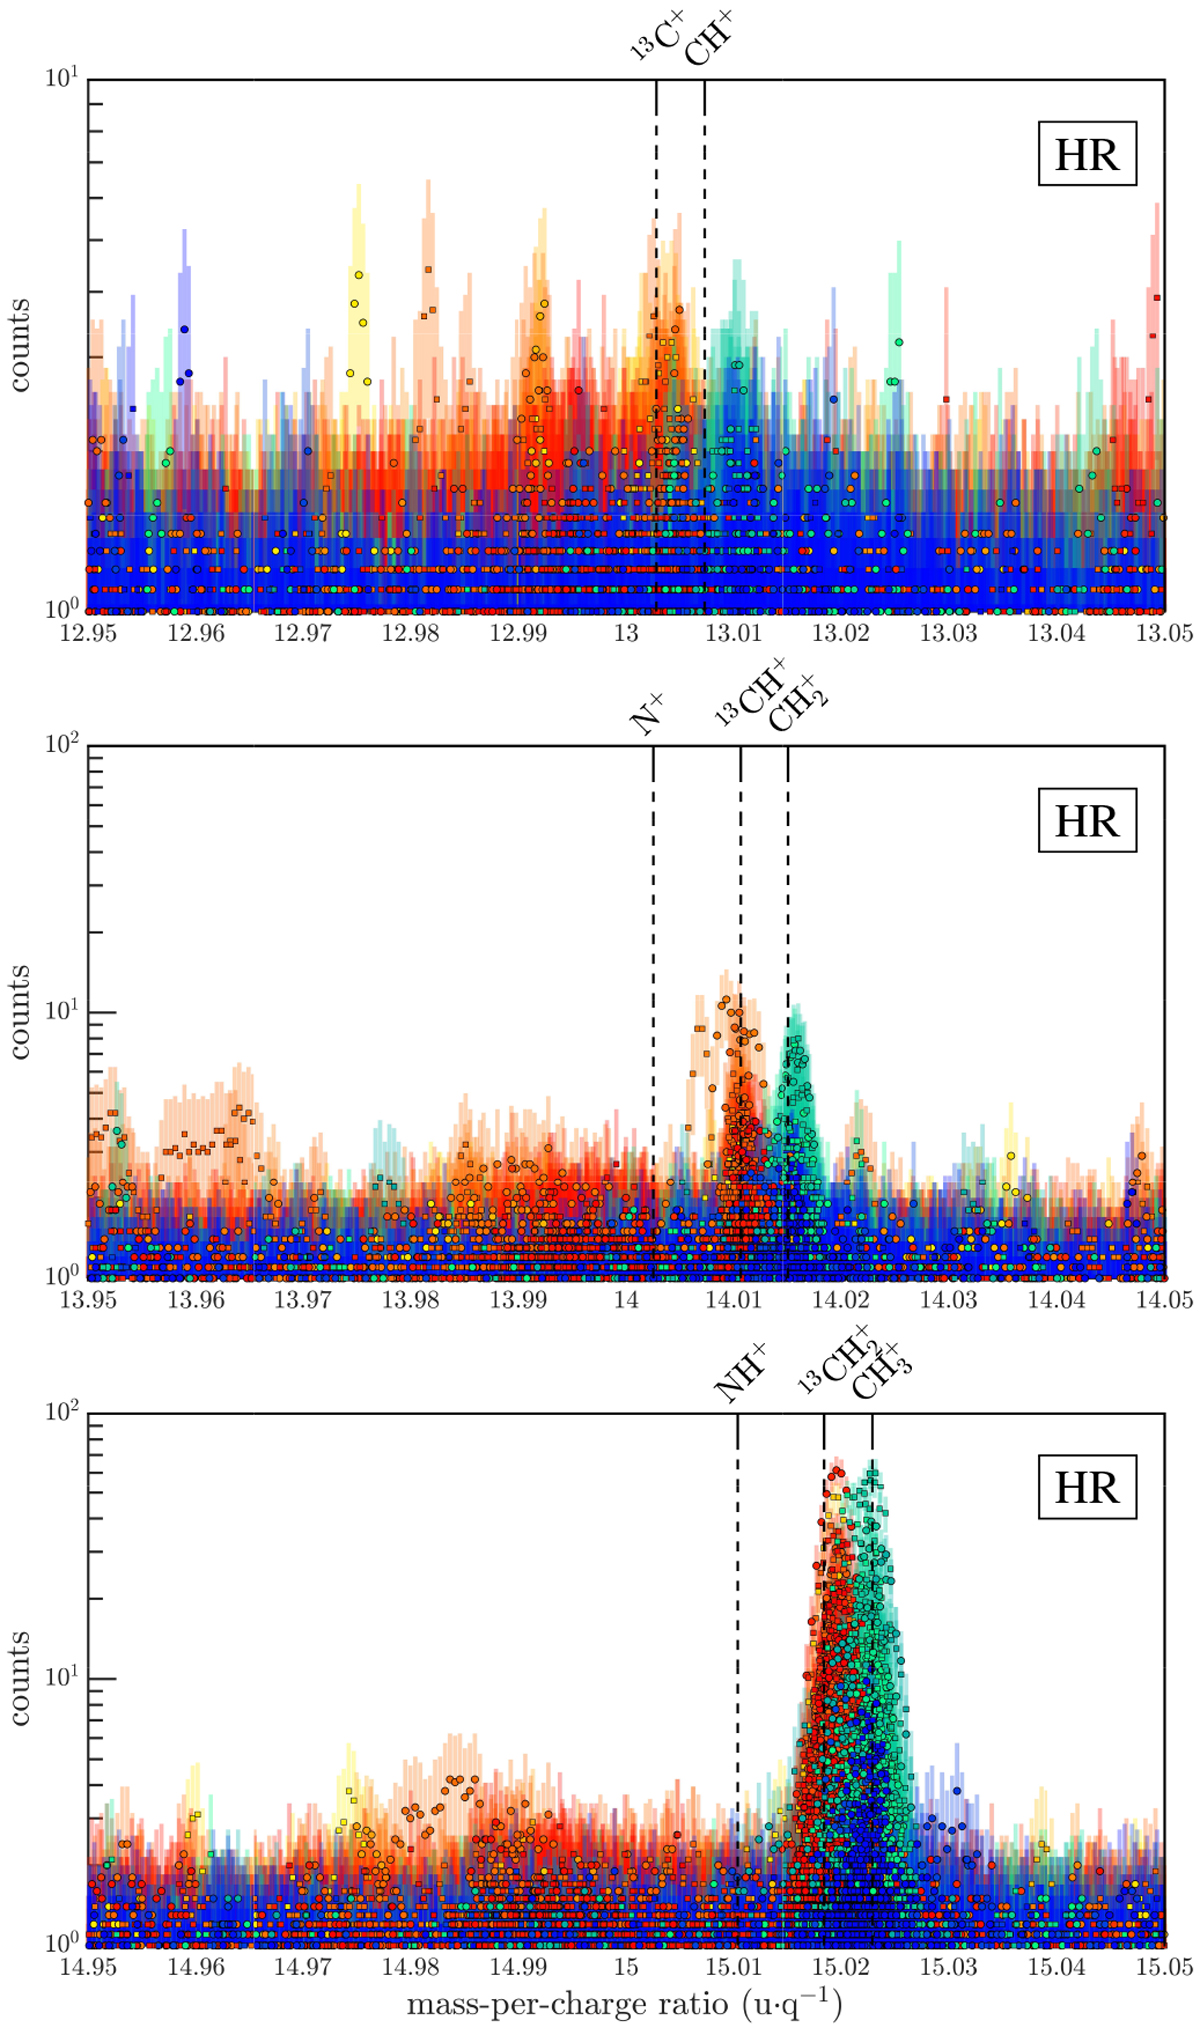
Original spectra when applying the procedure described in Sect, 2.2 with a zoom factor of 6.4 instead of 5.5 as suggested. Two distinct peaks appear whose location depends on the time of acquisition (warm colour, t < tshift; cold colours, t > tshift) and therefore are attributed to the change of the post-acceleration. In particular, the red colour is right before the shift and the green colour right afterwards according to the colour scale. Even if we applied a different zoom factor, more likely to be 5.5 here and therefore lower than assumed for the figure, both peaks for each spectrum would move to the left and be closer to each other and m0.
Current usage metrics show cumulative count of Article Views (full-text article views including HTML views, PDF and ePub downloads, according to the available data) and Abstracts Views on Vision4Press platform.
Data correspond to usage on the plateform after 2015. The current usage metrics is available 48-96 hours after online publication and is updated daily on week days.
Initial download of the metrics may take a while.