Fig. 1
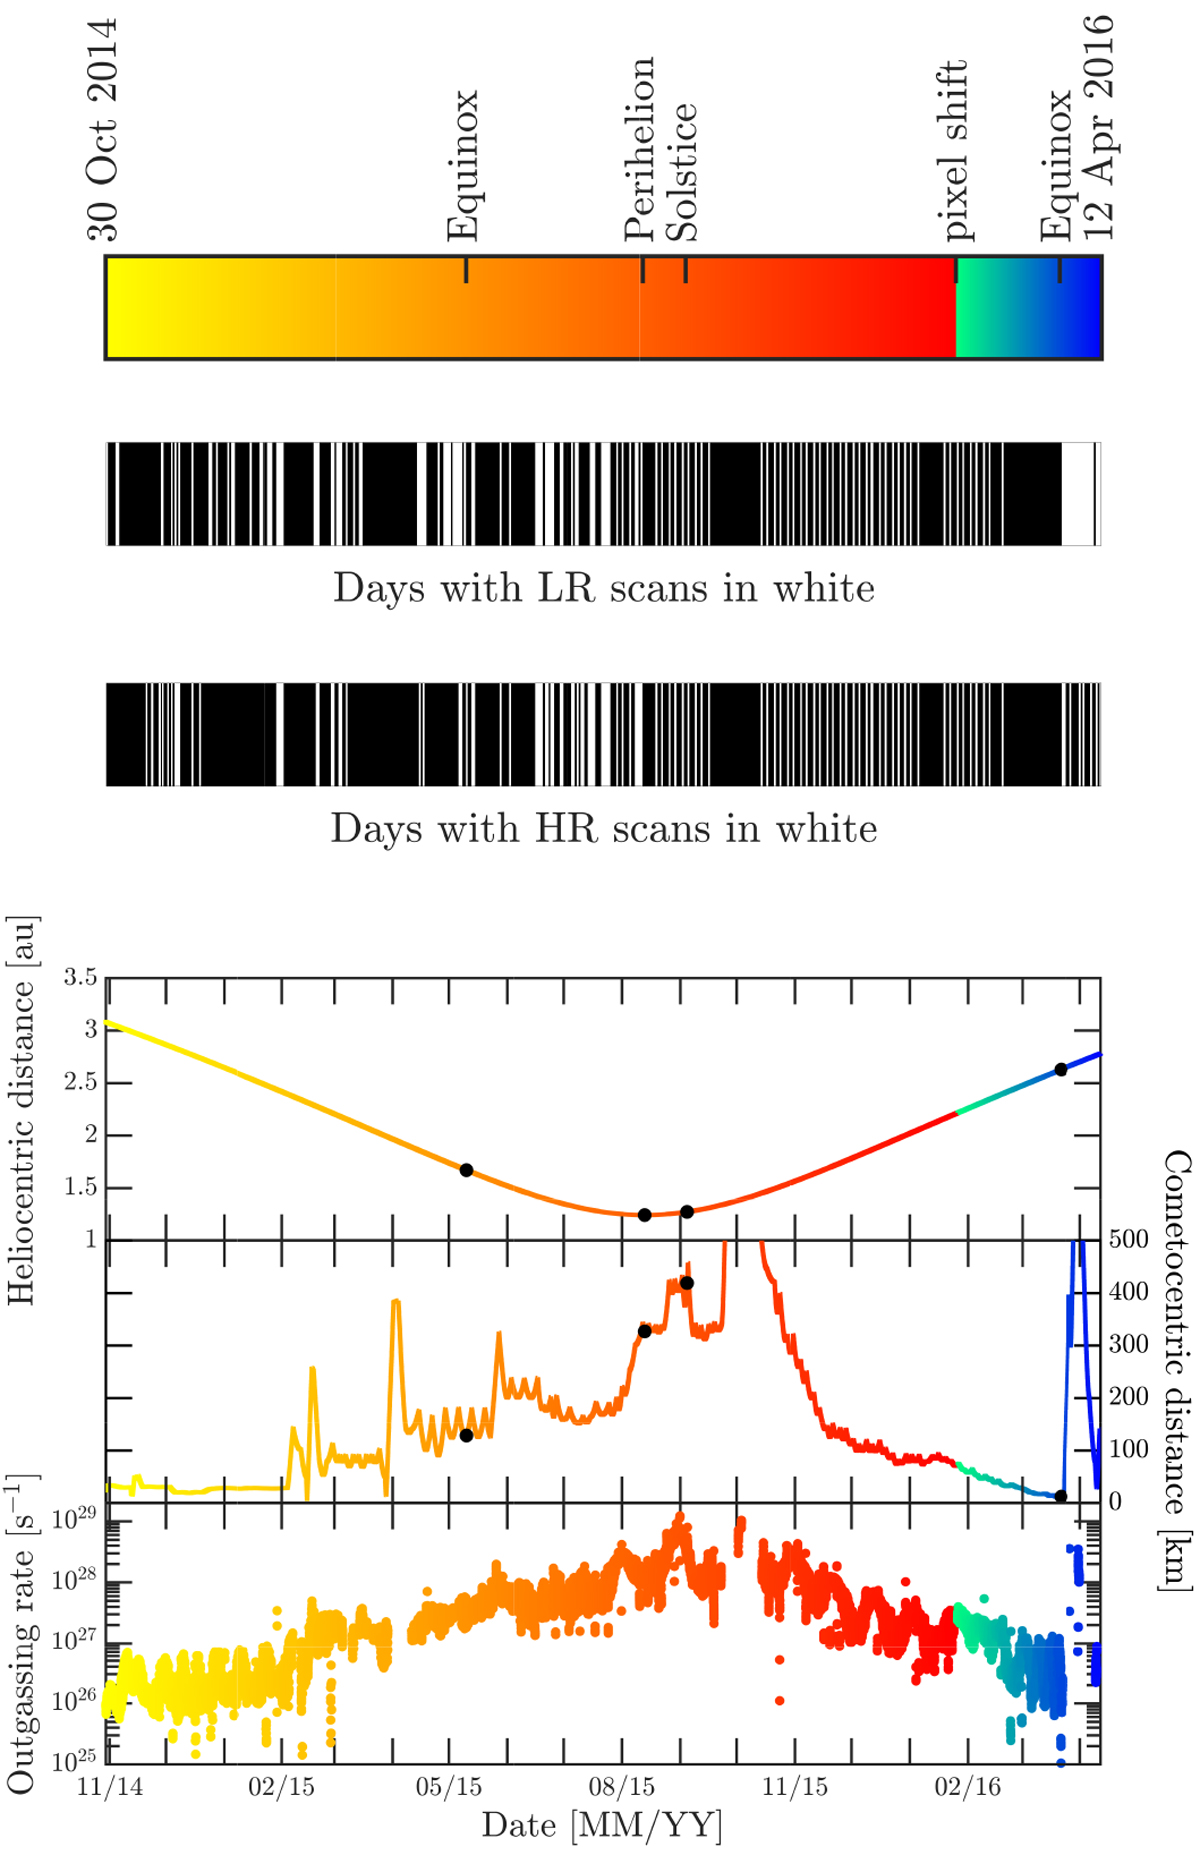
First panel: colour bar used for all spectra in LR and in HR. Spectra have been acquired between the 30th of October 2014 and the 12th of April 2016. A separation has been set on 27 January 2016 corresponding to the time when p0 has been voluntarily shifted in DFMS (see text and Appendix A). Colour bars representing the time coverage of DFMS spectra in LR (second panel) and HR (third panel) ion mode are also displayed. White means that sequences of scans are performed on that day and black none. Solstice refers to the Summer Solstice over the Southern Hemisphere (solar latitude = − 52°). Fourth panel: heliocentric distance, cometocentric distance, and local outgassing rate (≈ nn r2vn) as a function of time for the period of interest. Black dots correspond to (from left to right) the inbound Equinox, Perihelion, Solstice, and outbound Equinox. An outgassing speed vn of 1 km s−1 has been assumed for the outgassing.
Current usage metrics show cumulative count of Article Views (full-text article views including HTML views, PDF and ePub downloads, according to the available data) and Abstracts Views on Vision4Press platform.
Data correspond to usage on the plateform after 2015. The current usage metrics is available 48-96 hours after online publication and is updated daily on week days.
Initial download of the metrics may take a while.