Fig. 38.
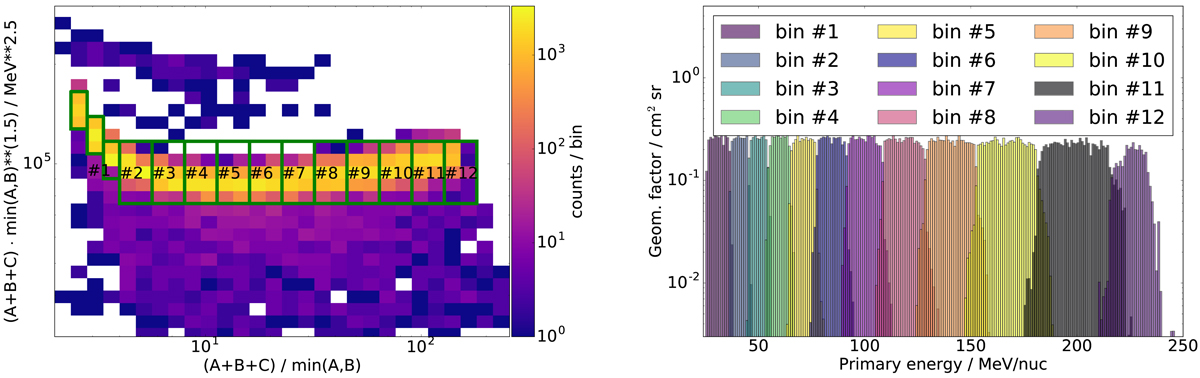
Simulated output of the HET ABC level-3 trigger for oxygen ions. Left-hand side: 2D histogram shows the level-3 trigger histogram including data product bins. Right-hand side: 1D histogram shows the energy range and geometric factor of these bins. The letters A, B, and C denote the energy deposition in the respective detectors A, B, and C.
Current usage metrics show cumulative count of Article Views (full-text article views including HTML views, PDF and ePub downloads, according to the available data) and Abstracts Views on Vision4Press platform.
Data correspond to usage on the plateform after 2015. The current usage metrics is available 48-96 hours after online publication and is updated daily on week days.
Initial download of the metrics may take a while.