Fig. 3.
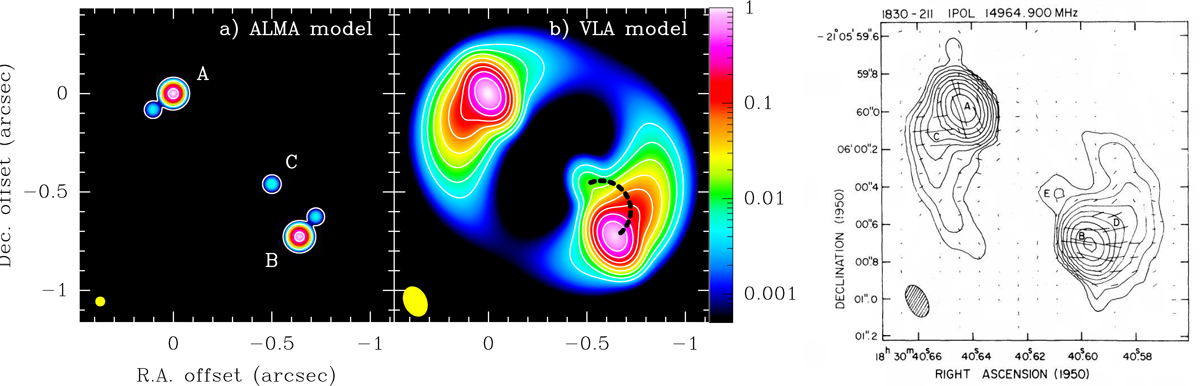
Results from the ALMA and VLA lens models (see Table B.2). Images are normalized to the peak intensity and smoothed to the beam (shown in bottom-left corner) given hereafter. (a) ALMA model with two point-like sources, smoothed to a resolution of 30 mas. Contour levels at 0.5, 0.01, and 0.0005. (b) VLA model, with one point-like and one extended source, smoothed to the same beam as the VLA-15 GHz observations by Subrahmanyan et al. (1990): 161 × 117 mas2, with a position angle of 26°. Contour levels every 1/2n, with n = 1 to 10. In our simulations, a thin jet would follow an arclet feature between images B and C, as indicated by the dashed curve. Right: VLA-15 GHz observations by Subrahmanyan et al. (1990). We note that their labels of the different features are not the same as ours: in this image, labels C and D mark the extensions from images A and B, and label E corresponds to the third image.
Current usage metrics show cumulative count of Article Views (full-text article views including HTML views, PDF and ePub downloads, according to the available data) and Abstracts Views on Vision4Press platform.
Data correspond to usage on the plateform after 2015. The current usage metrics is available 48-96 hours after online publication and is updated daily on week days.
Initial download of the metrics may take a while.