Fig. 1.
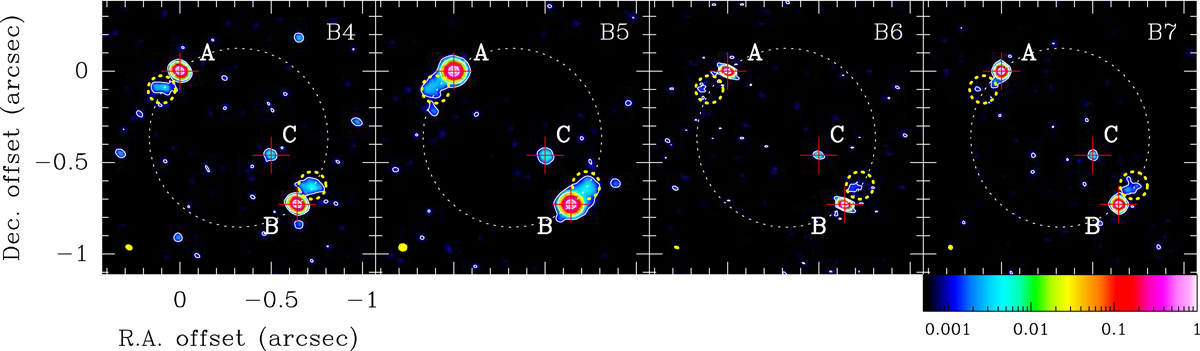
Continuum images of PKS 1830−211 obtained with ALMA in bands 4, 5, 6, and 7. Intensities are normalized to the peak of each image. The color wedge shown at the bottom of the extreme right box is the same for all images. Contour levels are drawn at 0.1%, 1%, and 50%. The positions of images A, B, and C are marked with red crosses. The weak extensions departing from images A and B are indicated by the yellow dashed circles. The center of the white dashed circle corresponds to the halfway point between images A and B. The synthesized beam is shown as the yellow ellipse in the bottom-left corner of each box.
Current usage metrics show cumulative count of Article Views (full-text article views including HTML views, PDF and ePub downloads, according to the available data) and Abstracts Views on Vision4Press platform.
Data correspond to usage on the plateform after 2015. The current usage metrics is available 48-96 hours after online publication and is updated daily on week days.
Initial download of the metrics may take a while.