Free Access
Fig. 3.
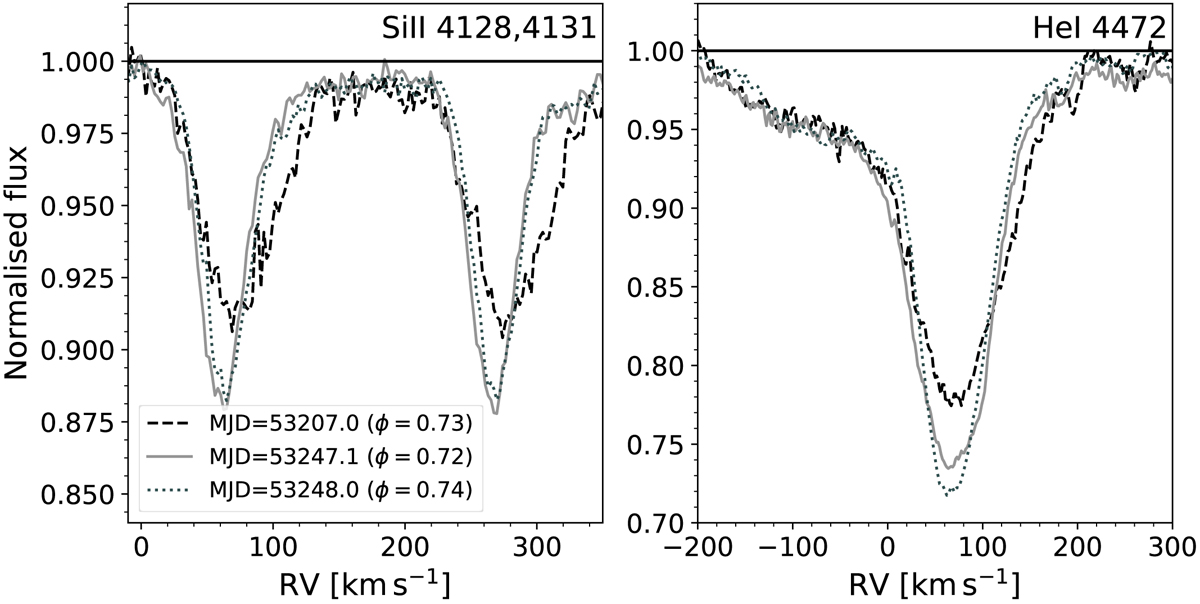
Three FEROS observations taken at ϕ ≈ 0.73 but at three different days with a time separation of about 1 d and 40 d (see legend). The panels zoom in on two Si II lines, dominated by the narrow-lined primary, and on the He I line, illustrating the apparent variability of the primary’s line profiles on the scale of weeks.
Current usage metrics show cumulative count of Article Views (full-text article views including HTML views, PDF and ePub downloads, according to the available data) and Abstracts Views on Vision4Press platform.
Data correspond to usage on the plateform after 2015. The current usage metrics is available 48-96 hours after online publication and is updated daily on week days.
Initial download of the metrics may take a while.