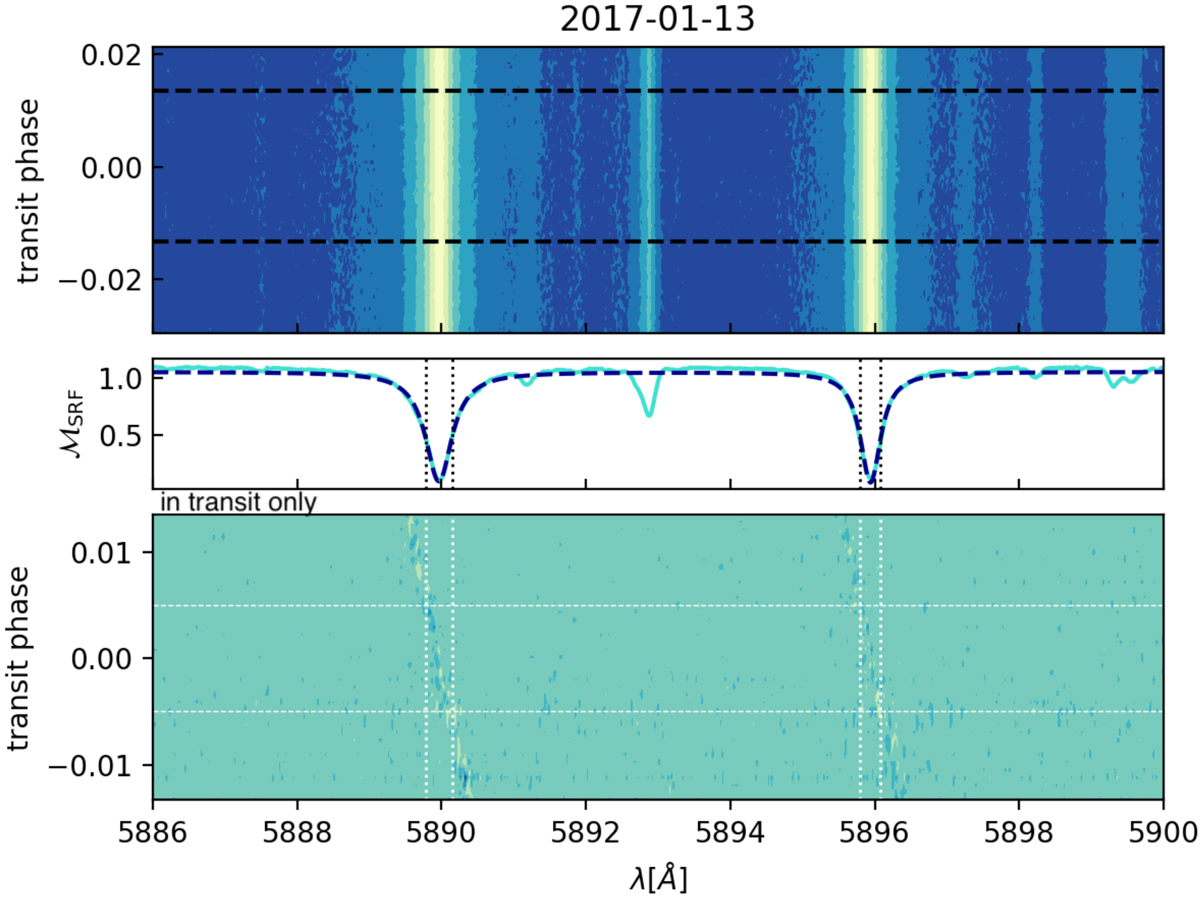
Fig. A.1.

Download original image
Upper panel: all spectra in the SRF as a 2D map of wavelength and transit phase for the first transit. The stellar sodium doublet is visible as two horizontal light yellow bands. Transit ingress and egress are shown as black dashed lines. Centre panel: normalised sum of all spectra with a fit to each line in dashed blue. The FWHM is indicated as dotted vertical lines. Lower panel: same data, but corrected for the stellar spectrum by the master-out, in the PRF. The dotted lines propagate the position of the FWHM from the central panel. The low S/N remnants are clearly visible, but the S/N is too low to see the planetary trace.
Current usage metrics show cumulative count of Article Views (full-text article views including HTML views, PDF and ePub downloads, according to the available data) and Abstracts Views on Vision4Press platform.
Data correspond to usage on the plateform after 2015. The current usage metrics is available 48-96 hours after online publication and is updated daily on week days.
Initial download of the metrics may take a while.


