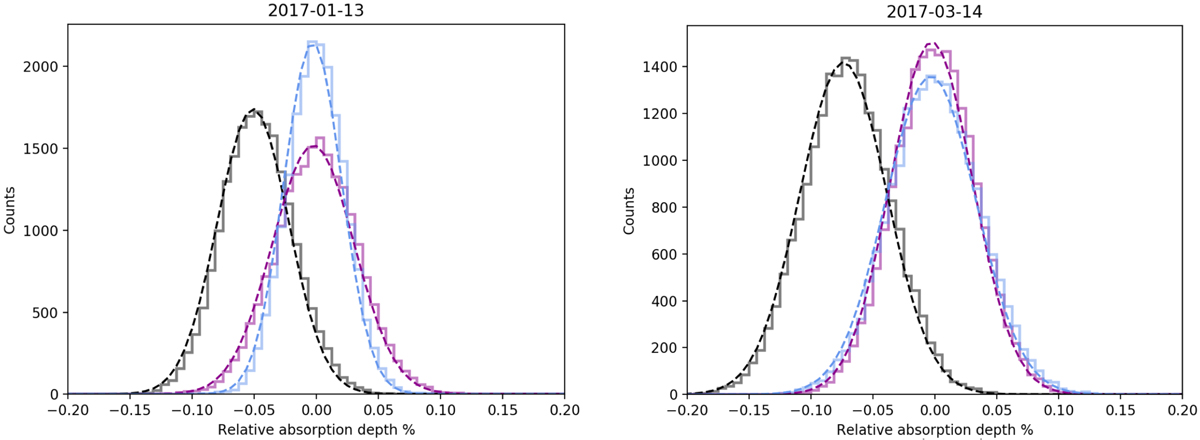
Fig. 5.
Download original image
Distributions of the EMC bootstrap analysis for the 12 Å passband for the two transits. The “in-in” (purple) and “out-out” (blue) distributions are both centred around zero (no sodium detection), but the randomised “in-out” distribution shows a detection (black). Each distribution was fitted with a Gaussian (dashed lines). Given that each night has a different number of observed spectra, each randomisation also has a different number of counts, and thus a different scaling of the y-axis.
Current usage metrics show cumulative count of Article Views (full-text article views including HTML views, PDF and ePub downloads, according to the available data) and Abstracts Views on Vision4Press platform.
Data correspond to usage on the plateform after 2015. The current usage metrics is available 48-96 hours after online publication and is updated daily on week days.
Initial download of the metrics may take a while.