Fig. 4.
Download original image
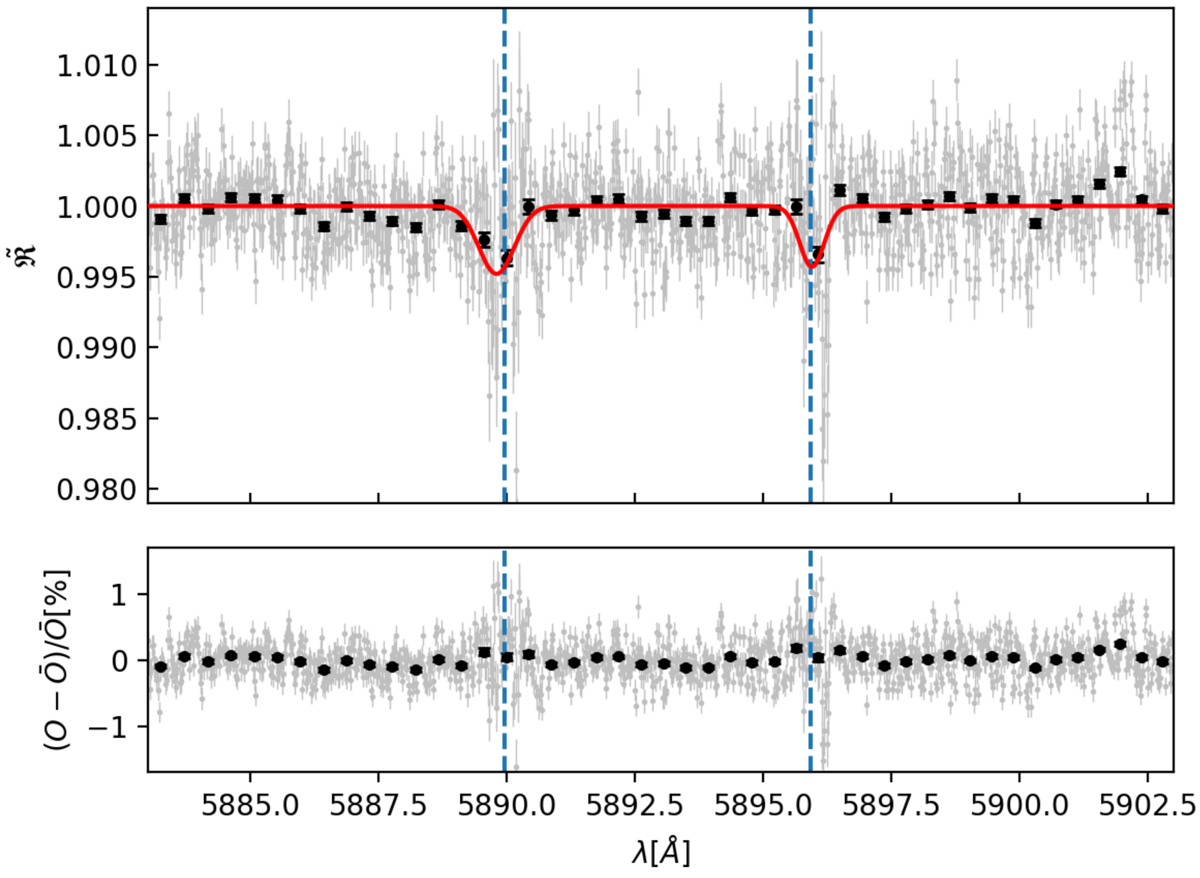
HARPS sodium doublet transmission spectrum of WASP-166b for all nights combined shown in the PRF. Upper panel: grey, data points at full HARPS resolution. In black, grey data points binned by ×25 for visibility. The theoretical line centres for the sodium doublets are shown as vertical blue dashed lines; a Gaussian fit to the unbinned data is shown in red. The sodium absorption is visible for both lines of the doublet. The combined line contrast is measured at 0.455 ± 0.135%, resulting in a 3.4σ detection (see Sect. 4.3). Lower panel: residuals of the Gaussian fit in percent.
Current usage metrics show cumulative count of Article Views (full-text article views including HTML views, PDF and ePub downloads, according to the available data) and Abstracts Views on Vision4Press platform.
Data correspond to usage on the plateform after 2015. The current usage metrics is available 48-96 hours after online publication and is updated daily on week days.
Initial download of the metrics may take a while.