Fig. 3.
Download original image
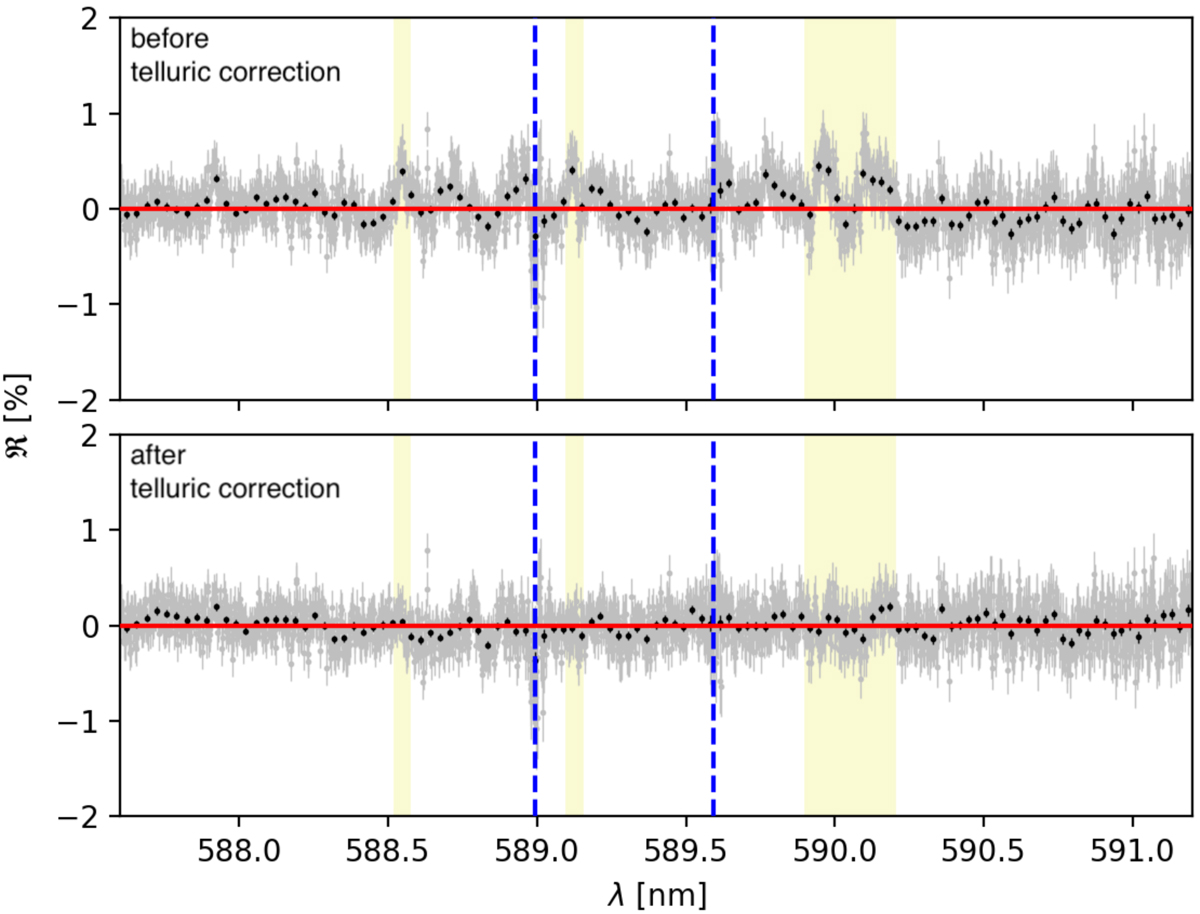
Recreation of the analysis as presented in Z2019 of the same observations used in this work without telluric correction (upper panel) and with telluric correction using molecfit (lower panel). Colours, scales, and binning recreate Fig. 5 of Z2019; the red line indicates the mean and the blue dashed line the expected positions of the sodium lines. Comparing Fig. 5 in Z2019 with our recreation attempt shows that Z2019 has residuals from telluric lines (most pronounced in wavelength bands highlighted in light yellow).
Current usage metrics show cumulative count of Article Views (full-text article views including HTML views, PDF and ePub downloads, according to the available data) and Abstracts Views on Vision4Press platform.
Data correspond to usage on the plateform after 2015. The current usage metrics is available 48-96 hours after online publication and is updated daily on week days.
Initial download of the metrics may take a while.