Fig. 2.
Download original image
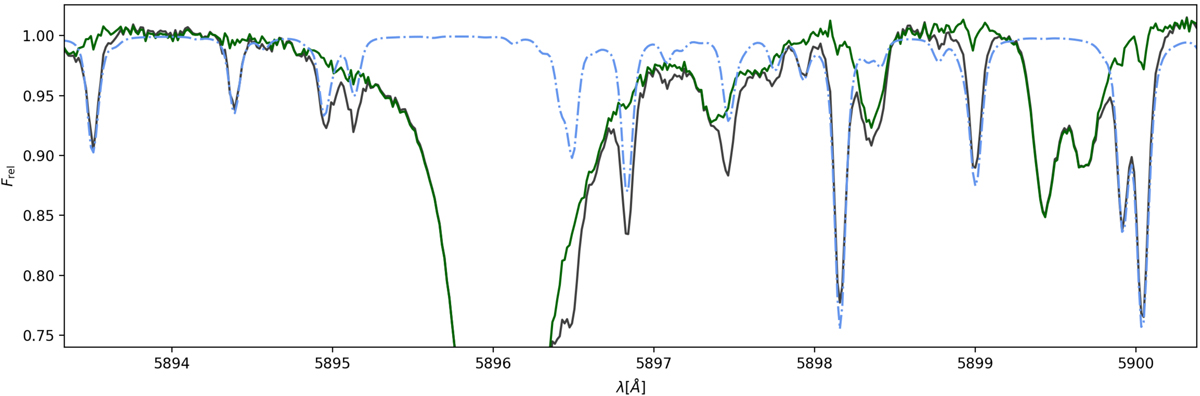
Normalised sum over all spectra taken during night 1 around the sodium D1 line at ∼5896 Å. The normalised sum before telluric correction is shown in black, after the application of the telluric correction in dark green. The light blue dash-dotted line indicates the telluric profile generated for the spectra at transit centre for night 1. The telluric influence on the spectra was corrected down to the noise level and does not impact the transmission spectrum.
Current usage metrics show cumulative count of Article Views (full-text article views including HTML views, PDF and ePub downloads, according to the available data) and Abstracts Views on Vision4Press platform.
Data correspond to usage on the plateform after 2015. The current usage metrics is available 48-96 hours after online publication and is updated daily on week days.
Initial download of the metrics may take a while.