Fig. 3.
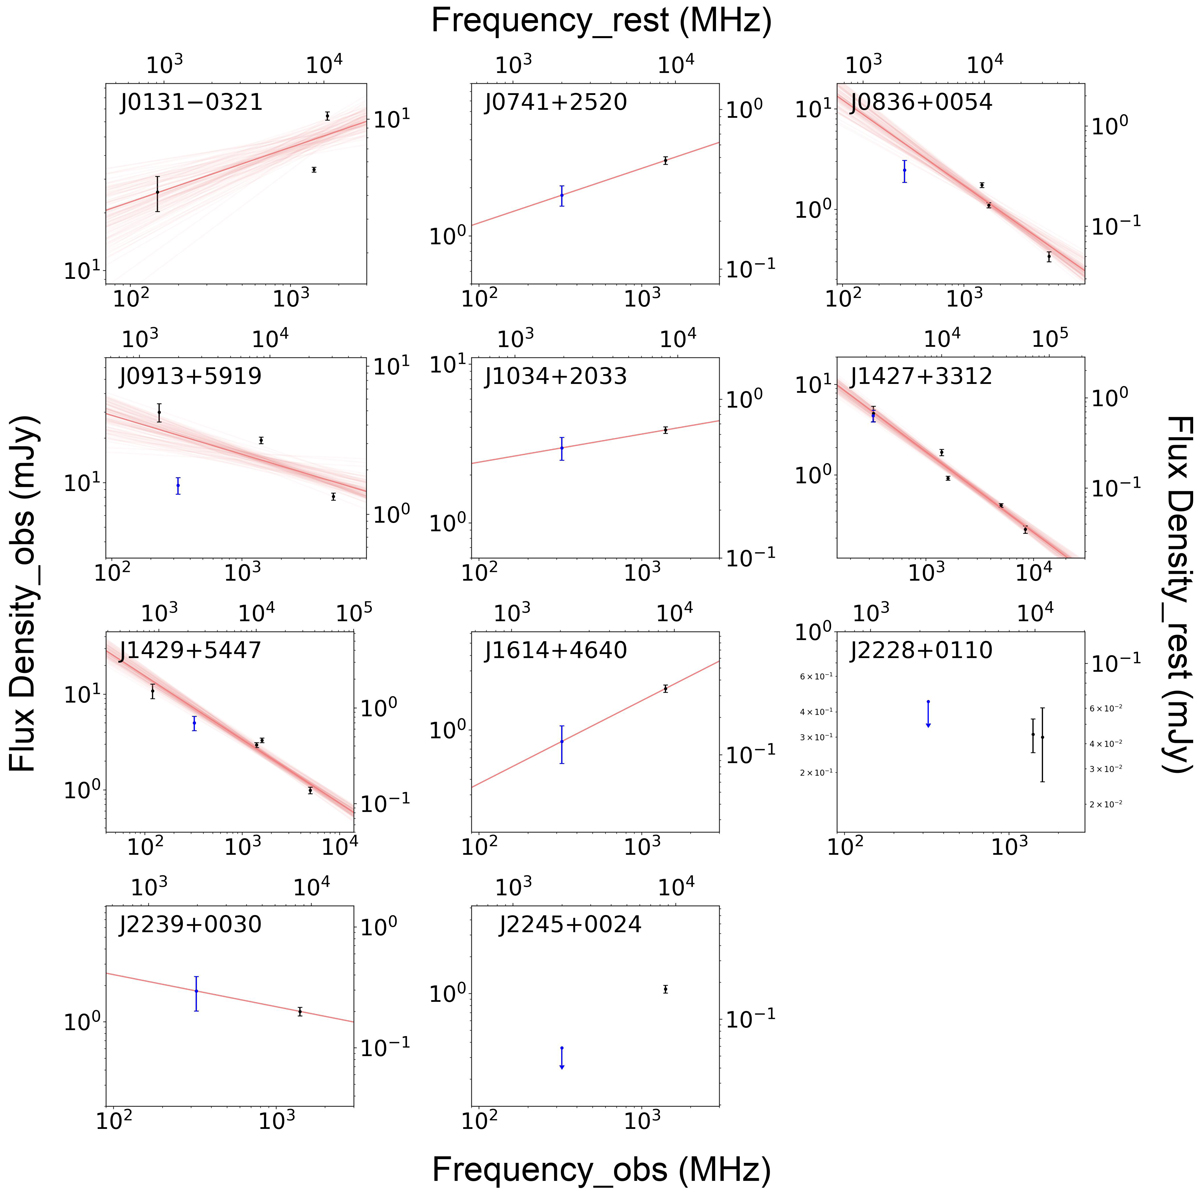
Spectral model fit with the standard nonthermal power-law model. The black points with error bars represent archival data taken from the literature. The blue points with error bars or downward arrows indicate GMRT 323 MHz measurements from our work. Calibration errors of 10% were added to the statistical errors of the GMRT 323 MHz data points (Chandra et al. 2004). The red lines represent the fitted models. For fits employing the MCMC method, 100 models were randomly selected from the parameter space as red shaded areas to visualize the model uncertainties. There is not enough data in the cases of J2228+0110 and J2245+0024, thus the measurements are given without any fitting. The fitted results are presented in Table 4.
Current usage metrics show cumulative count of Article Views (full-text article views including HTML views, PDF and ePub downloads, according to the available data) and Abstracts Views on Vision4Press platform.
Data correspond to usage on the plateform after 2015. The current usage metrics is available 48-96 hours after online publication and is updated daily on week days.
Initial download of the metrics may take a while.