Fig. 8.
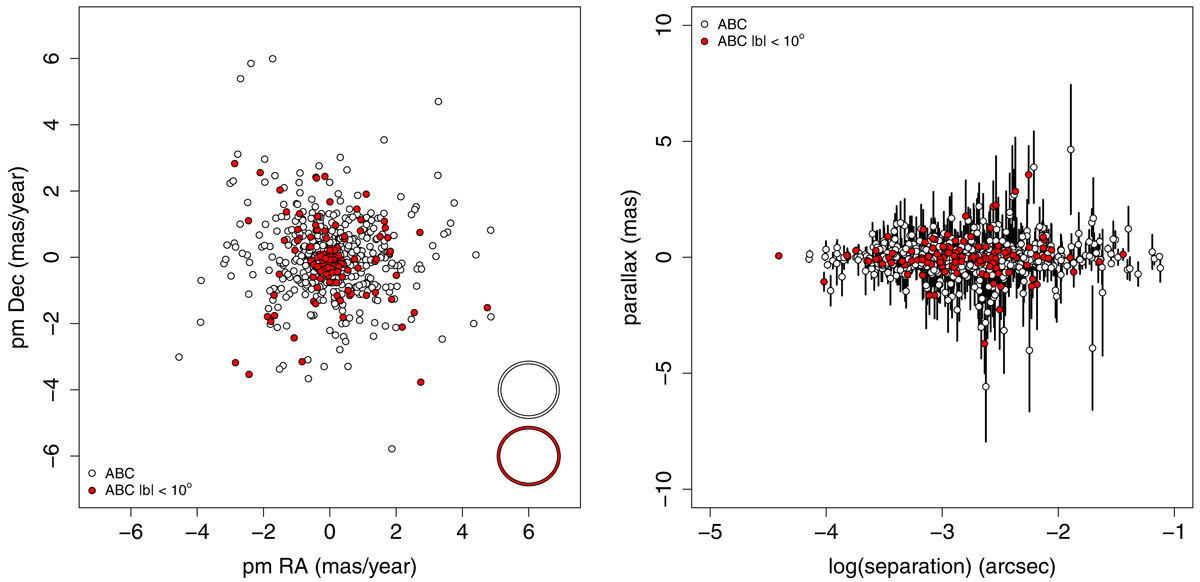
Left panel: distribution of the 805 possible Gaia identifications in the motion plane (see Sect. 4.1.2). The white circles represent all possible Gaia identifications, and the red circles represent the sources close to the Galactic plane (|b| < 10°). The ellipses in the lower-right corner represent the average uncertainties for possible Gaia identifications (white ellipse) and for the sources close to the Galactic plane (red ellipse). Right panel: Gaia parallaxes of the possible associations versus separation between the ABC sources and their Gaia matches. The vertical bars represent the 1-σ errors on parallax, the white circles represent all possible Gaia identifications, and the red circles represent the sources close to the Galactic plane.
Current usage metrics show cumulative count of Article Views (full-text article views including HTML views, PDF and ePub downloads, according to the available data) and Abstracts Views on Vision4Press platform.
Data correspond to usage on the plateform after 2015. The current usage metrics is available 48-96 hours after online publication and is updated daily on week days.
Initial download of the metrics may take a while.