Fig. 7.
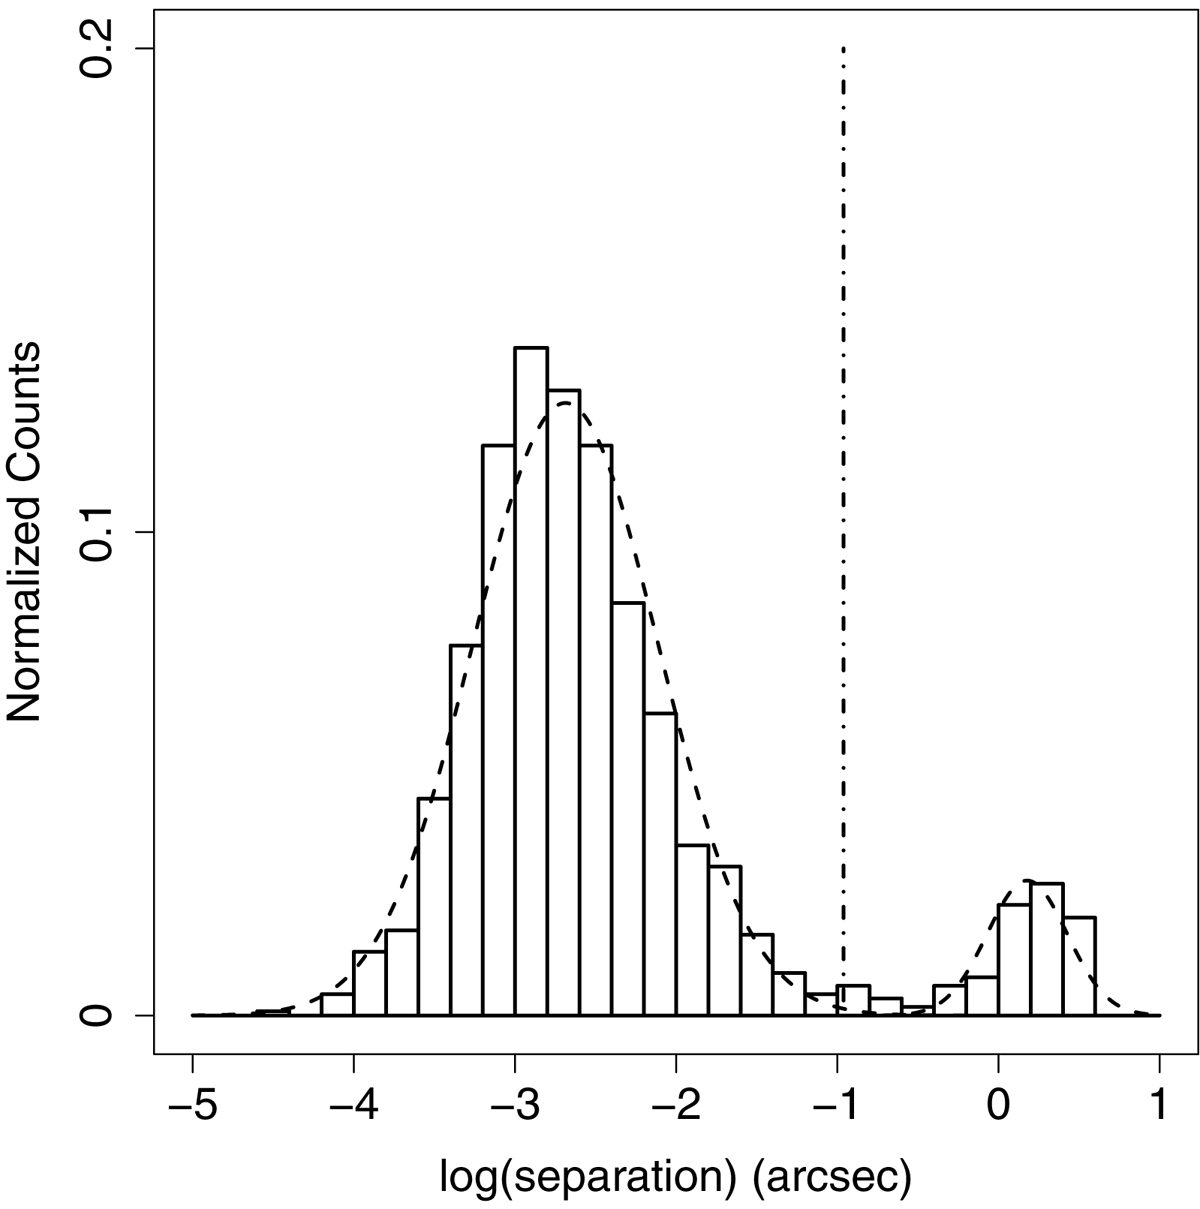
Distribution of the separations between the ABC source positions and its closest Gaia match. The dashed lines represent the two gaussians fitting the separation distribution. The vertical dot-dashed line represents the three-sigma deviation from the mean of the largest gaussian, chosen as the boundary for reliable matches (see Sect. 4.1.2).
Current usage metrics show cumulative count of Article Views (full-text article views including HTML views, PDF and ePub downloads, according to the available data) and Abstracts Views on Vision4Press platform.
Data correspond to usage on the plateform after 2015. The current usage metrics is available 48-96 hours after online publication and is updated daily on week days.
Initial download of the metrics may take a while.