Free Access
Fig. 4.
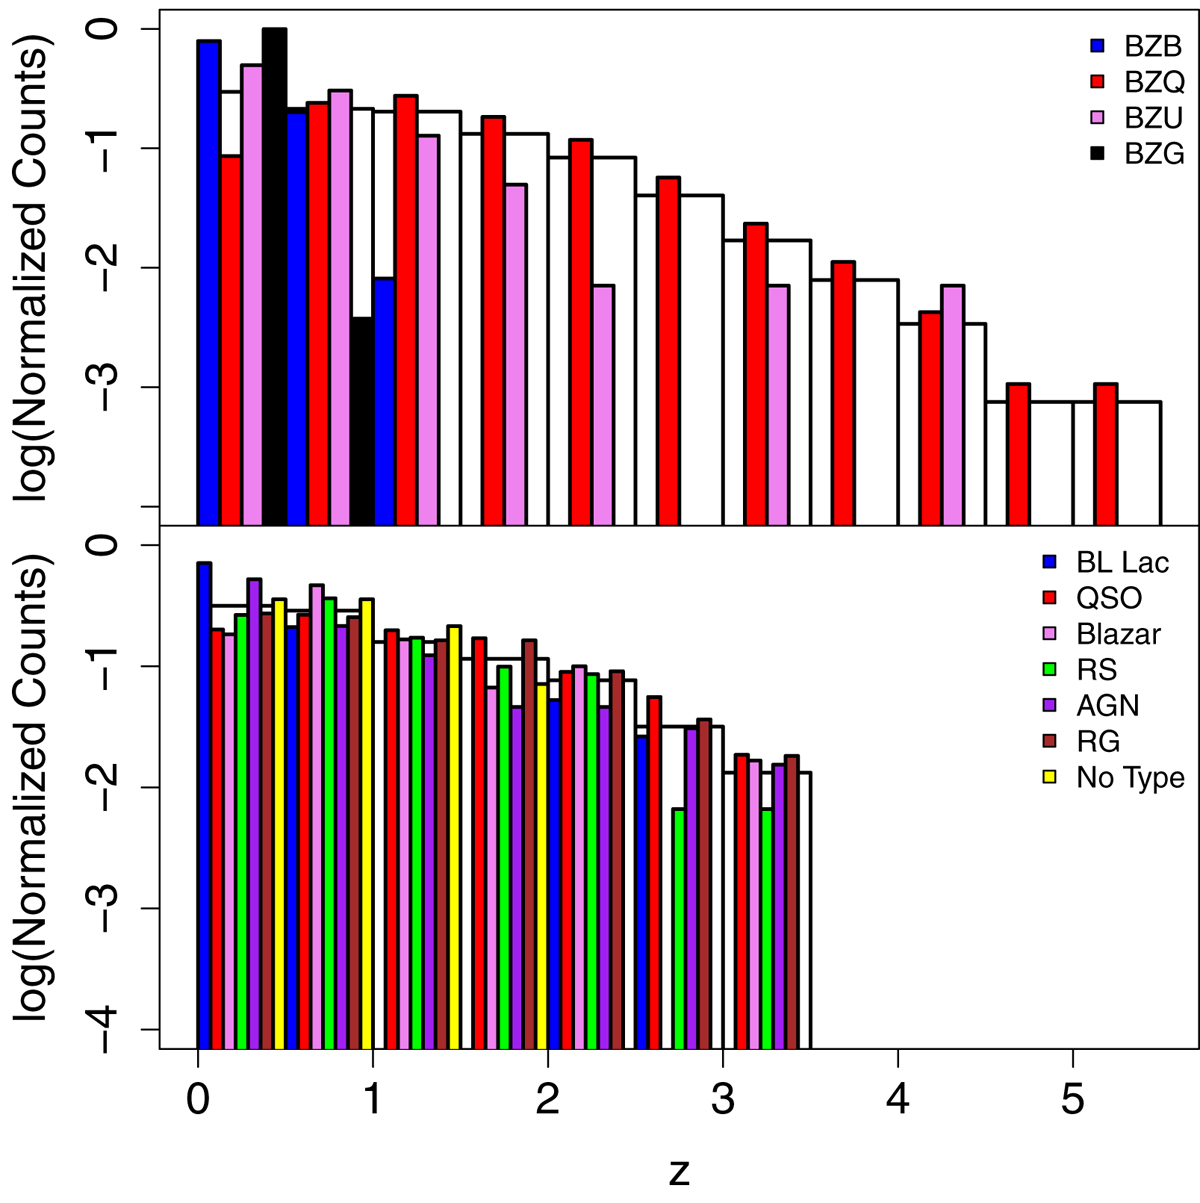
Upper panel: redshift distribution of sources. The colored bars represent the different source classes indicated in the legend, while the white bars in the background show the redshift distribution of the whole Roma-BZCAT catalog. Lower panel: same as the upper panel, but for ABC sources.
Current usage metrics show cumulative count of Article Views (full-text article views including HTML views, PDF and ePub downloads, according to the available data) and Abstracts Views on Vision4Press platform.
Data correspond to usage on the plateform after 2015. The current usage metrics is available 48-96 hours after online publication and is updated daily on week days.
Initial download of the metrics may take a while.