Fig. 23.
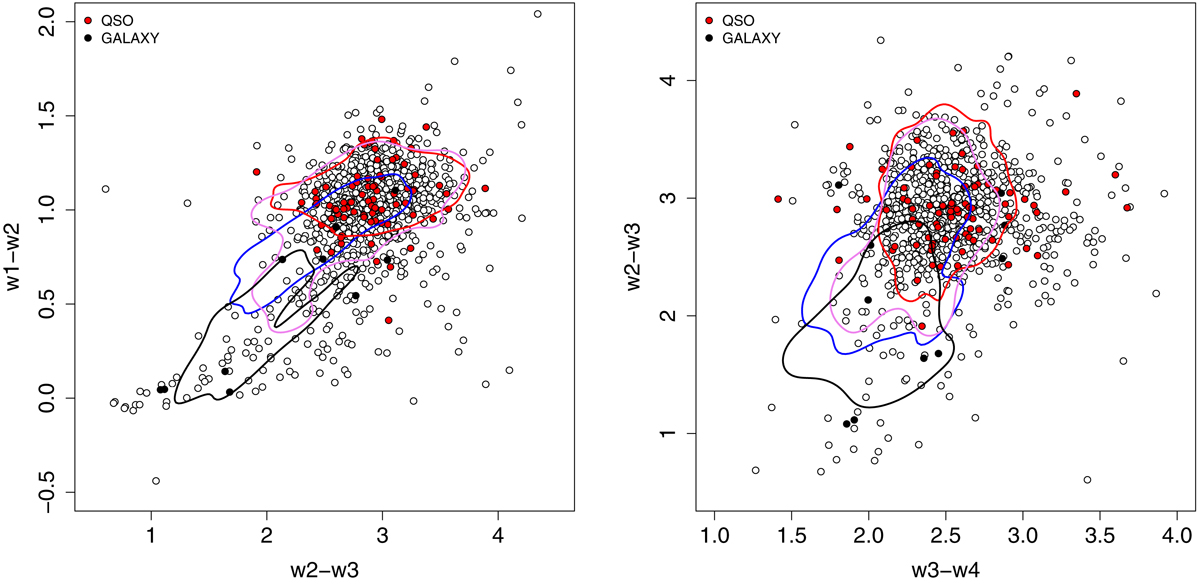
Left panel: ABC sources with a WISE counterpart detected in all four WISE bands (white circles) represented in the w1 − w2 versus w2 − w3 color–color plane. The same KDE isodensity contours of Fig. 20 are presented with lines of different colors for the different Roma-BZCAT subclasses, as indicated in the legend. Filled red and black circles mark sources with an optical spectroscopic classification of QSO and GALAXY, respectively. Right panel: same as the left panel, but for the w2 − w3 versus w3 − w4 projection.
Current usage metrics show cumulative count of Article Views (full-text article views including HTML views, PDF and ePub downloads, according to the available data) and Abstracts Views on Vision4Press platform.
Data correspond to usage on the plateform after 2015. The current usage metrics is available 48-96 hours after online publication and is updated daily on week days.
Initial download of the metrics may take a while.