Fig. 21.
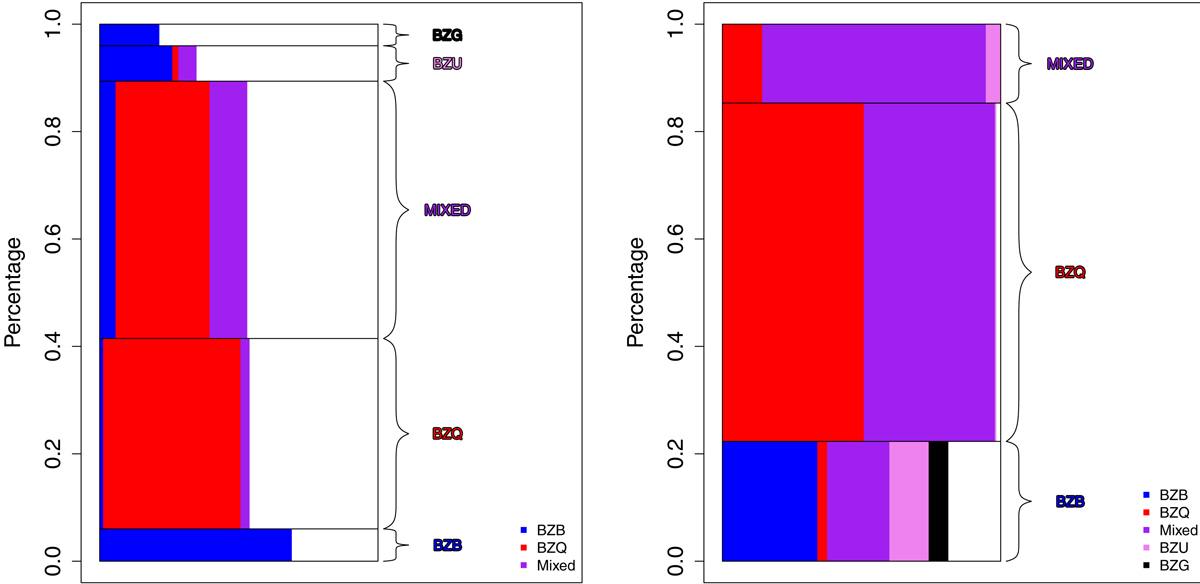
Left panel: comparison of our classification method and the one proposed by D’Abrusco et al. (2019) for the WIBRaLS2 catalog. The black rectangles represent the γ-ray blazar candidate classes selected by our method, while the colored bars in each rectangle represent the percentage of sources also classified in WIBRaLS2 catalog. Right panel: same as left panel, but with black rectangles representing the γ-ray blazar candidate classes of WIBRaLS2 catalog, and with the colored bars representing the percentage of sources also classified in the present work.
Current usage metrics show cumulative count of Article Views (full-text article views including HTML views, PDF and ePub downloads, according to the available data) and Abstracts Views on Vision4Press platform.
Data correspond to usage on the plateform after 2015. The current usage metrics is available 48-96 hours after online publication and is updated daily on week days.
Initial download of the metrics may take a while.