Fig. 2.
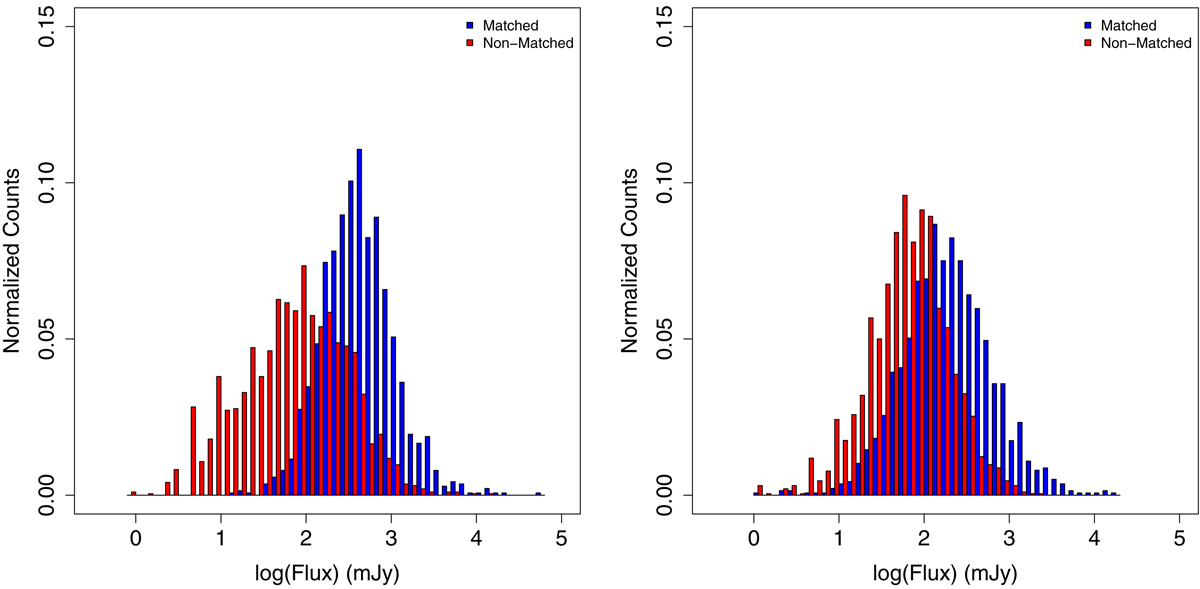
Left panel: comparison of the normalized distributions of the radio fluxes densities at 1.4 or 0.843 GHz (as listed in the Roma-BZCAT) for the Roma-BZCAT sources with a match in the ACC catalog (blue) and for the Roma-BZCAT sources below < 60° of declination without a match in the ACC catalog (red). Right panel: comparison of the normalized distributions of the average ALMA band 3 radio fluxes densities for the ACC sources with a match in the Roma-BZCAT (blue) and for the ACC sources without a match in the Roma-BZCAT (red).
Current usage metrics show cumulative count of Article Views (full-text article views including HTML views, PDF and ePub downloads, according to the available data) and Abstracts Views on Vision4Press platform.
Data correspond to usage on the plateform after 2015. The current usage metrics is available 48-96 hours after online publication and is updated daily on week days.
Initial download of the metrics may take a while.