Fig. 19.
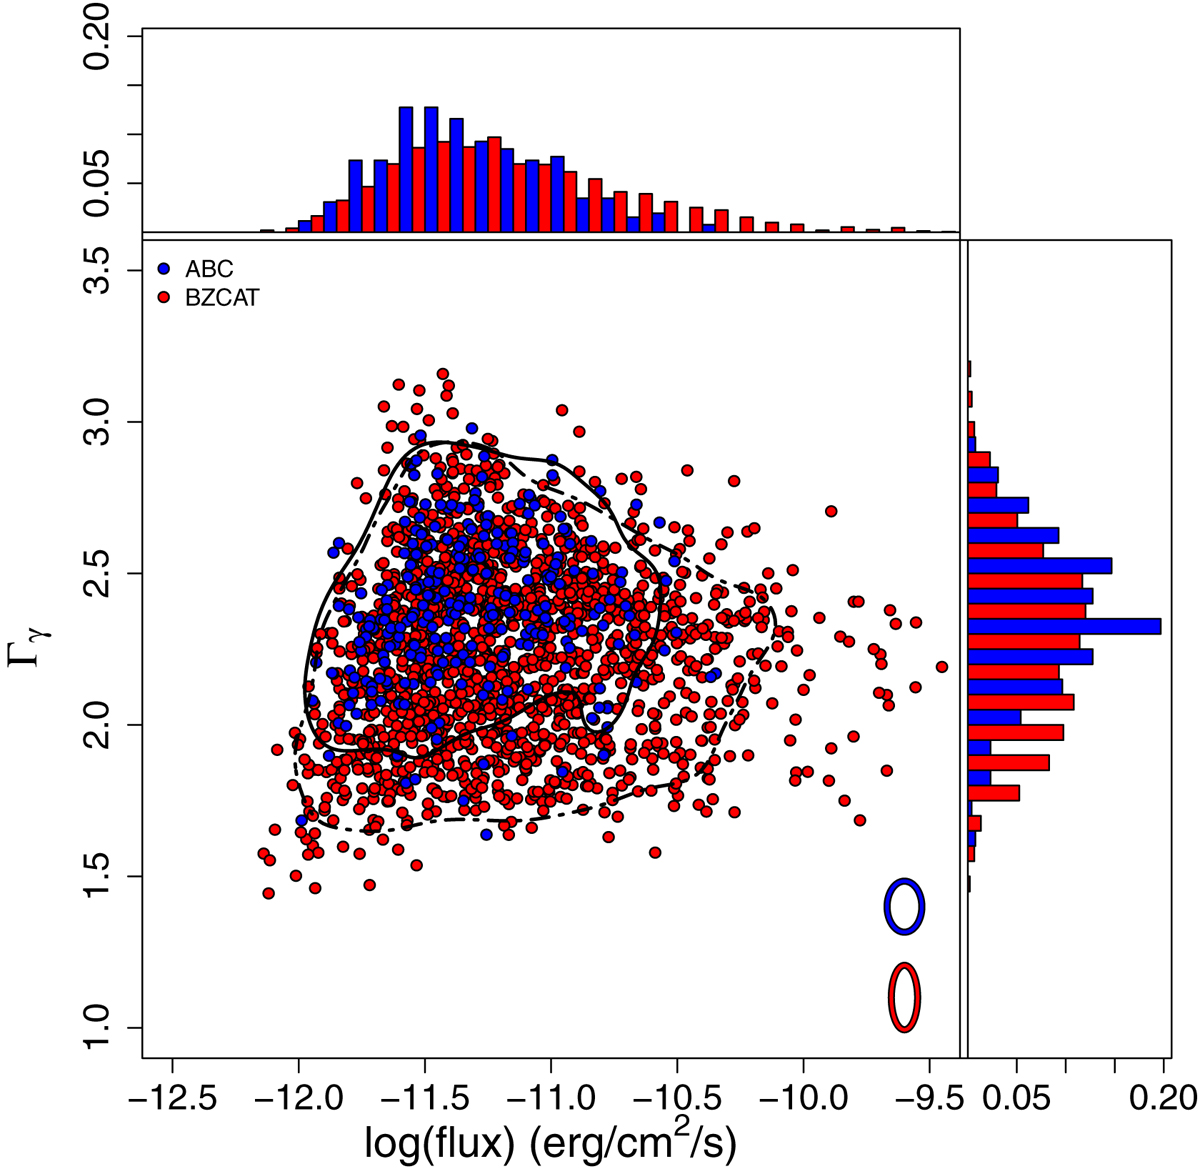
ABC (blue circles) and Roma-BZCAT (red circles) sources represented on the γ-ray slope versus γ-ray flux plot. The ellipses of the relative color indicate the average uncertainties. The black full and dot-dashed lines represent the 90% KDE isodensity contours for ABC sources and Roma-BZCAT sources, respectively. On the top and right panels, we present the normalized distributions of the γ-ray flux and slope for ABC and Roma-BZCAT sources, with the same colors used in the main panel.
Current usage metrics show cumulative count of Article Views (full-text article views including HTML views, PDF and ePub downloads, according to the available data) and Abstracts Views on Vision4Press platform.
Data correspond to usage on the plateform after 2015. The current usage metrics is available 48-96 hours after online publication and is updated daily on week days.
Initial download of the metrics may take a while.