Fig. 12.
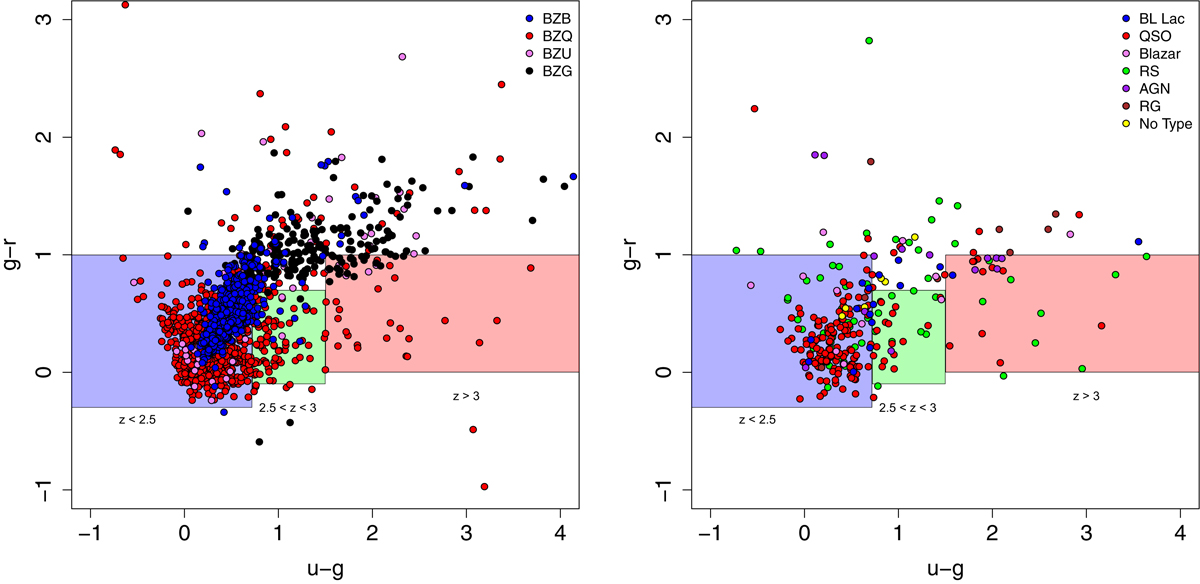
Distribution of Roma-BZCAT (left panel) and ABC (right panel) sources in the SDSS g − r versus u − g color–color plane. The three colored rectangles represent the regions indicated by Butler & Bloom (2011) to select low (z < 2.5), intermediate (2.5 < z < 3), and high (z > 3) redshift quasars. Roma-BZCAT and ABC subclasses are represented with circles of different colors, as indicated in the legend.
Current usage metrics show cumulative count of Article Views (full-text article views including HTML views, PDF and ePub downloads, according to the available data) and Abstracts Views on Vision4Press platform.
Data correspond to usage on the plateform after 2015. The current usage metrics is available 48-96 hours after online publication and is updated daily on week days.
Initial download of the metrics may take a while.