Fig. 10.
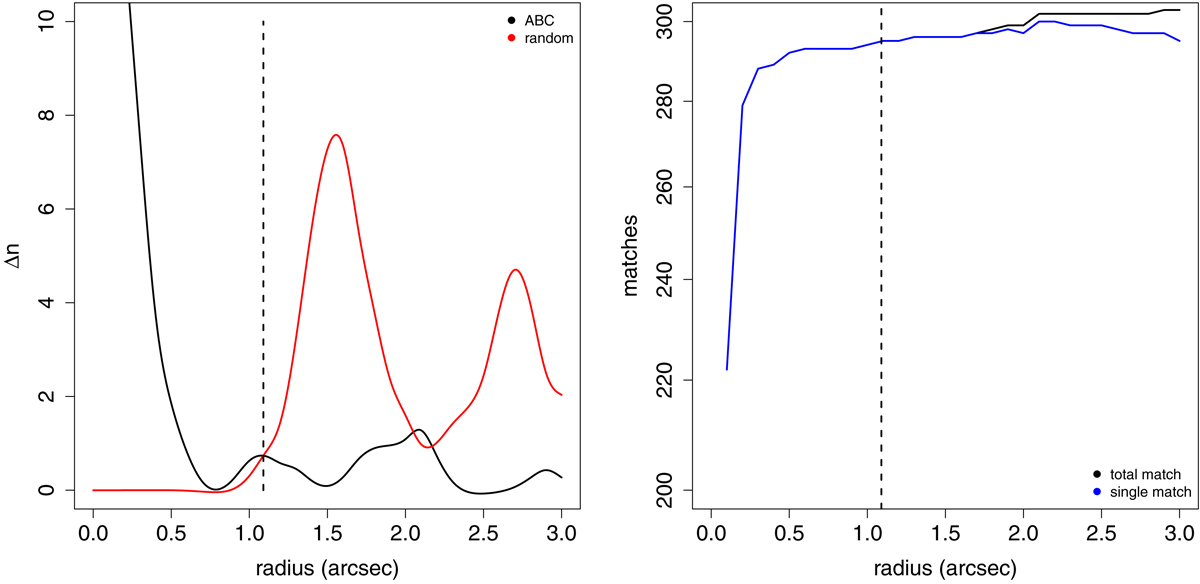
Left panel: increase of sources with at least one SDSS counterpart (Δn) plotted versus the search radius for ABC sources (black line) and for random positions in the sky (red line). Lines representing (Δn) were smoothed for better visualization. The optimal search radius is represented with a vertical dashed line. Right panel: number of matches between ABC sources and SDSS DR12 sources plotted versus the search radius. The number of ABC sources with at least one match in SDSS DR12 is indicated with a black line, while the number of ABC the sources with a single match in SDSS DR12 is indicated with a blue line. As in the right panel, the optimal search radius is represented with a vertical dashed line.
Current usage metrics show cumulative count of Article Views (full-text article views including HTML views, PDF and ePub downloads, according to the available data) and Abstracts Views on Vision4Press platform.
Data correspond to usage on the plateform after 2015. The current usage metrics is available 48-96 hours after online publication and is updated daily on week days.
Initial download of the metrics may take a while.