Free Access
Fig. A.1.
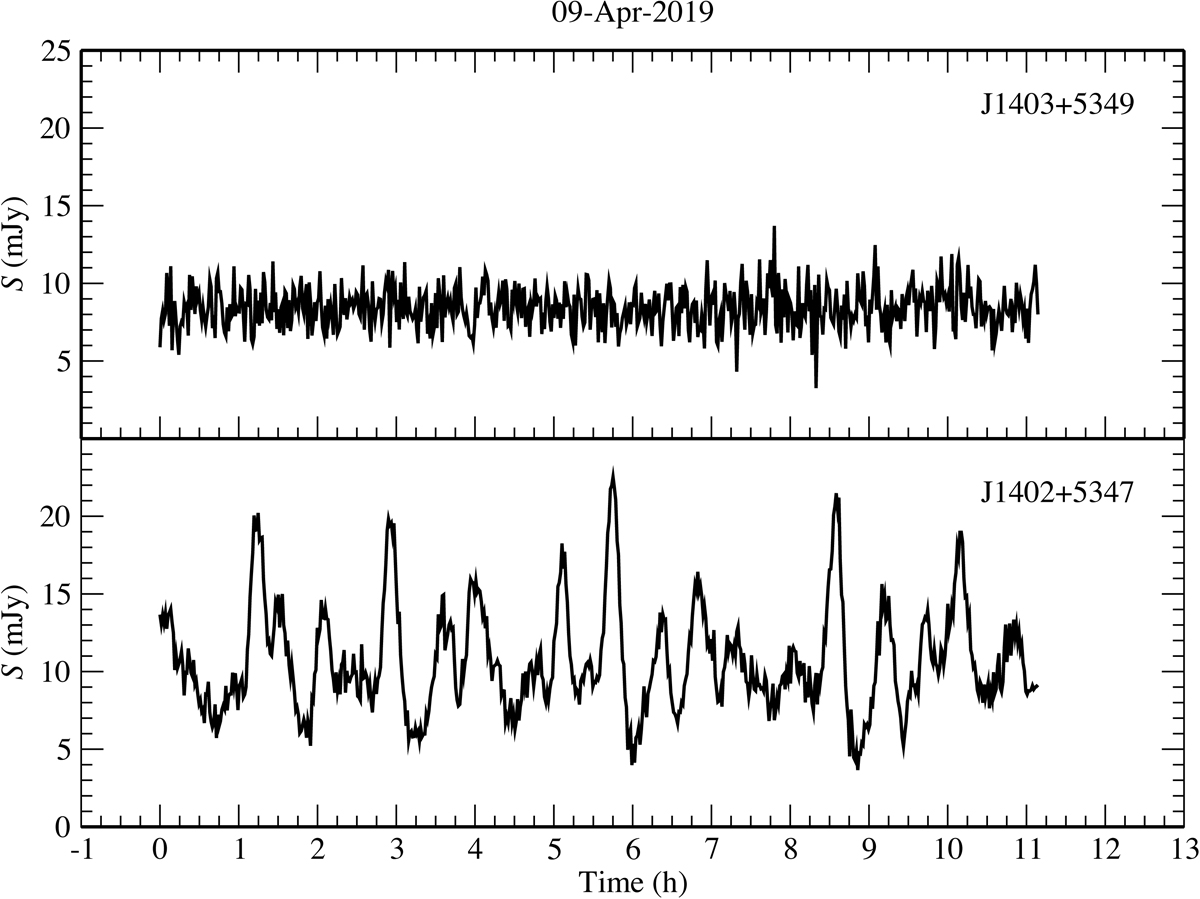
Light curves derived for April 9, 2019, of the variable source J1402+5347 and the steady comparison source J1403+5349, 9 arcmin west of J1402+5347, illustrating the accuracy of the method for constructing the light curves. The horizontal axis shows the time since the start of the observation.
Current usage metrics show cumulative count of Article Views (full-text article views including HTML views, PDF and ePub downloads, according to the available data) and Abstracts Views on Vision4Press platform.
Data correspond to usage on the plateform after 2015. The current usage metrics is available 48-96 hours after online publication and is updated daily on week days.
Initial download of the metrics may take a while.