Fig. 4.
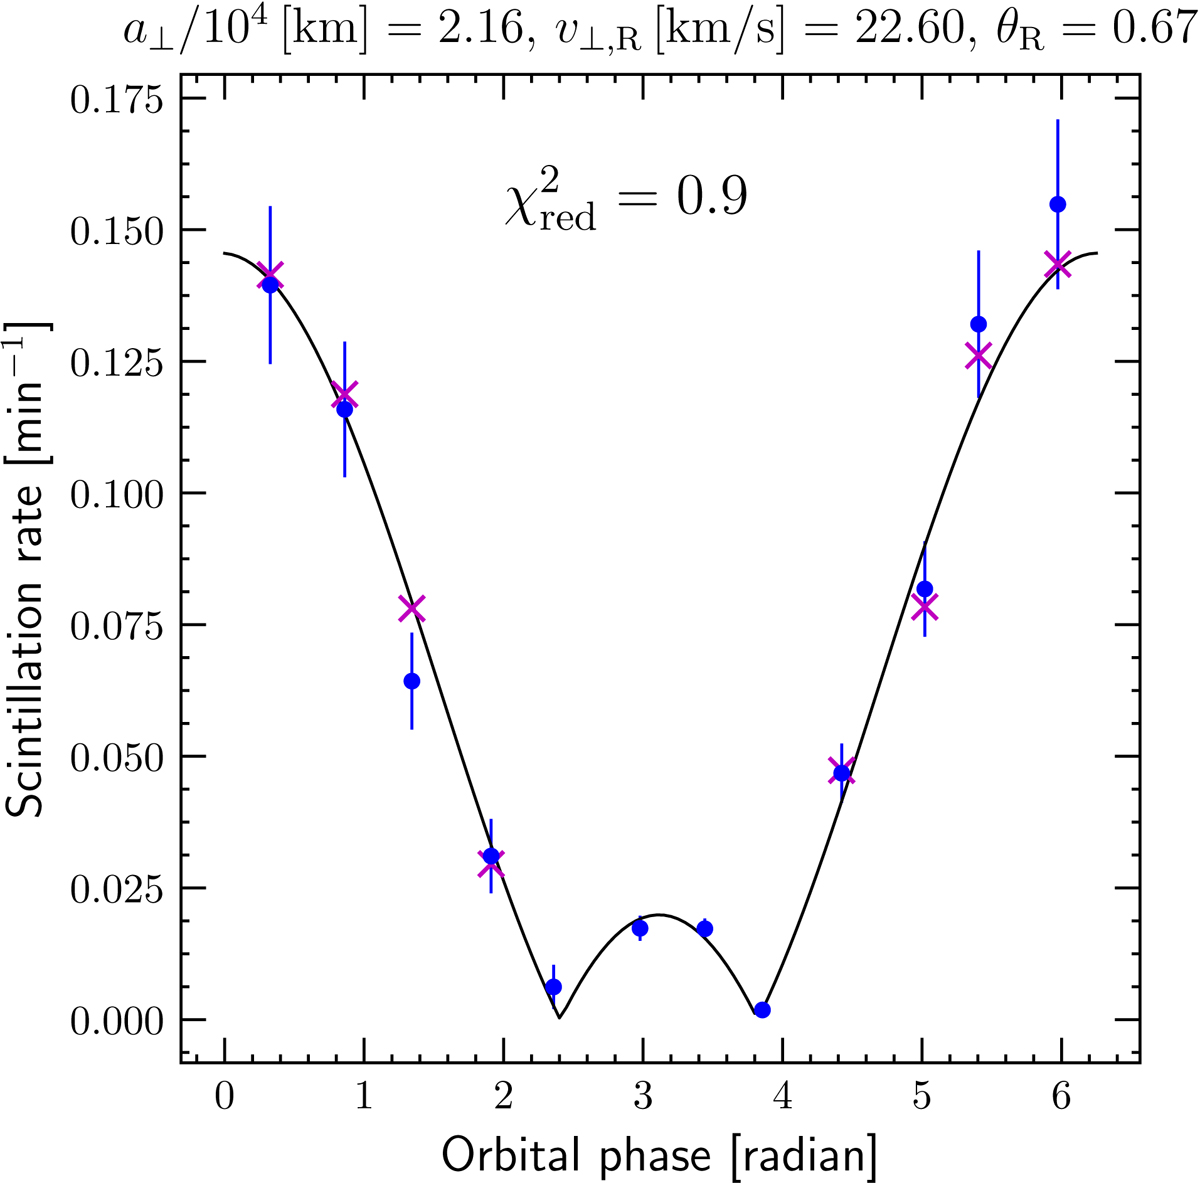
Scintillation rate determined through a Gaussian regression analysis (blue points with ±1σ errors); the maximum likelihood model (black curve) is overplotted. The annotated text gives the model parameters and the reduced χ2 of the fit. The phase at the vernal equinox is defined to be zero, with phase increasing with time. Magenta crosses show the inverse of the scintillation timescale measured directly from the autocorrelation function (ACF) of the light curves during epochs of sufficiently rapid variations.
Current usage metrics show cumulative count of Article Views (full-text article views including HTML views, PDF and ePub downloads, according to the available data) and Abstracts Views on Vision4Press platform.
Data correspond to usage on the plateform after 2015. The current usage metrics is available 48-96 hours after online publication and is updated daily on week days.
Initial download of the metrics may take a while.