Fig. 3.
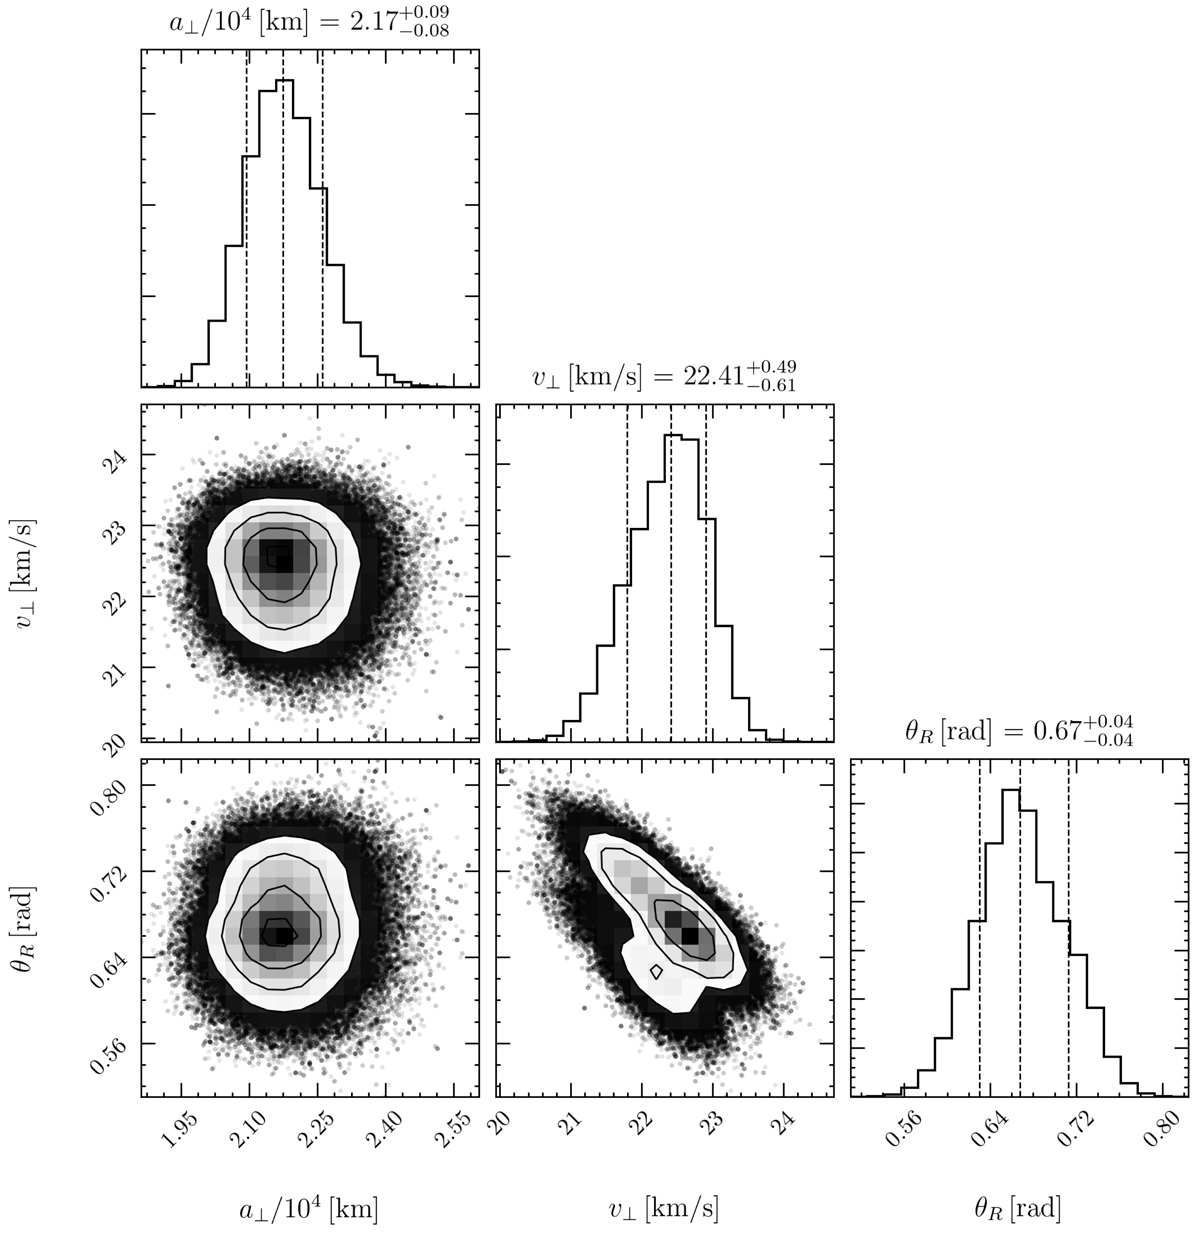
Posterior distribution of the model parameters describing the annual modulation of the scintillation rate. The panels on the diagonal are the marginalised one-dimensional posterior distributions. The dashed black lines are drawn at 0.16, 0.5, and 0.84 quartiles. The annotated text gives the best-fit parameters and ±1σ bounds implied by the posterior distributions.
Current usage metrics show cumulative count of Article Views (full-text article views including HTML views, PDF and ePub downloads, according to the available data) and Abstracts Views on Vision4Press platform.
Data correspond to usage on the plateform after 2015. The current usage metrics is available 48-96 hours after online publication and is updated daily on week days.
Initial download of the metrics may take a while.