Free Access
Fig. 2.
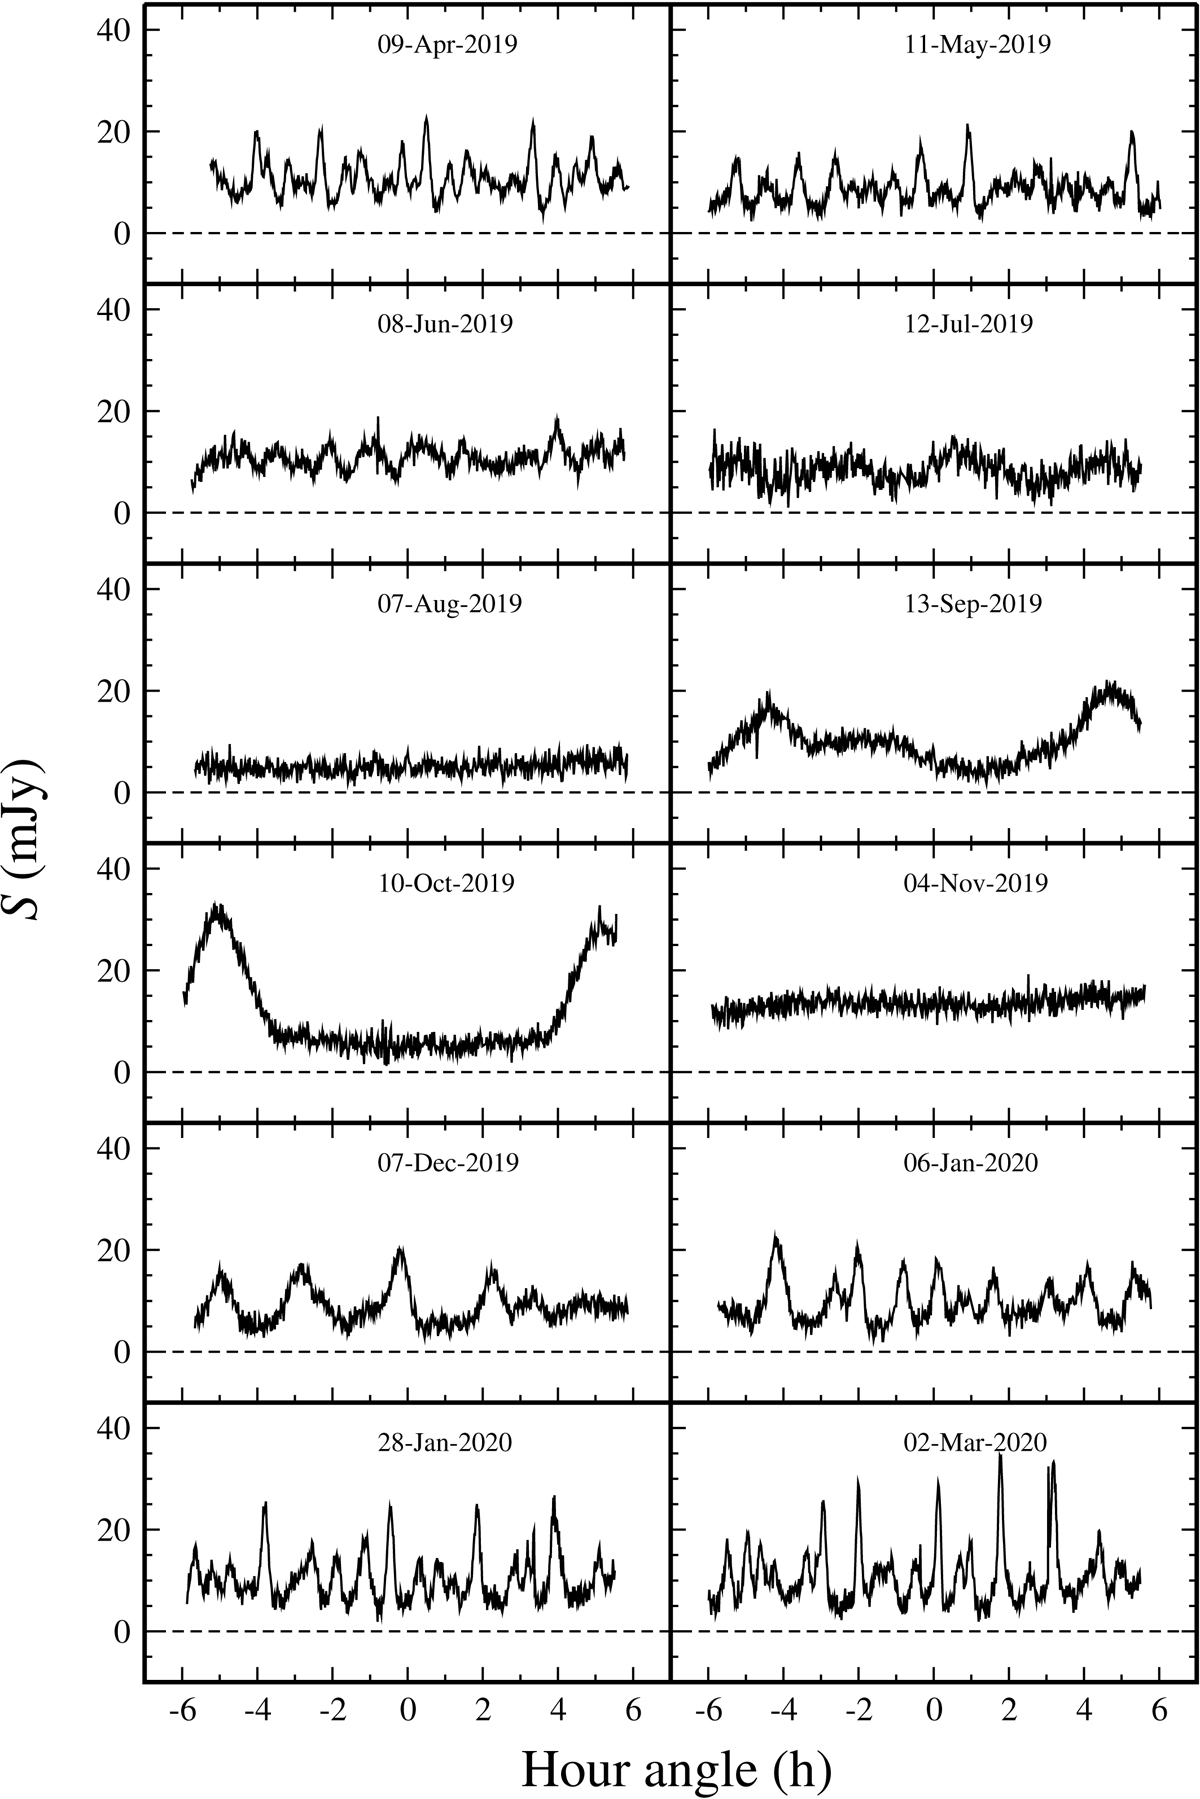
Light curves of J1402+5347 observed over a year with a monthly cadence. The observation dates are indicated. The annual modulation in the variation rate is apparent. We observe two standstills in August 2019 and November 2019, while the most rapid variations occurred in April 2019 and March 2020.
Current usage metrics show cumulative count of Article Views (full-text article views including HTML views, PDF and ePub downloads, according to the available data) and Abstracts Views on Vision4Press platform.
Data correspond to usage on the plateform after 2015. The current usage metrics is available 48-96 hours after online publication and is updated daily on week days.
Initial download of the metrics may take a while.