Free Access
Fig. D.1.
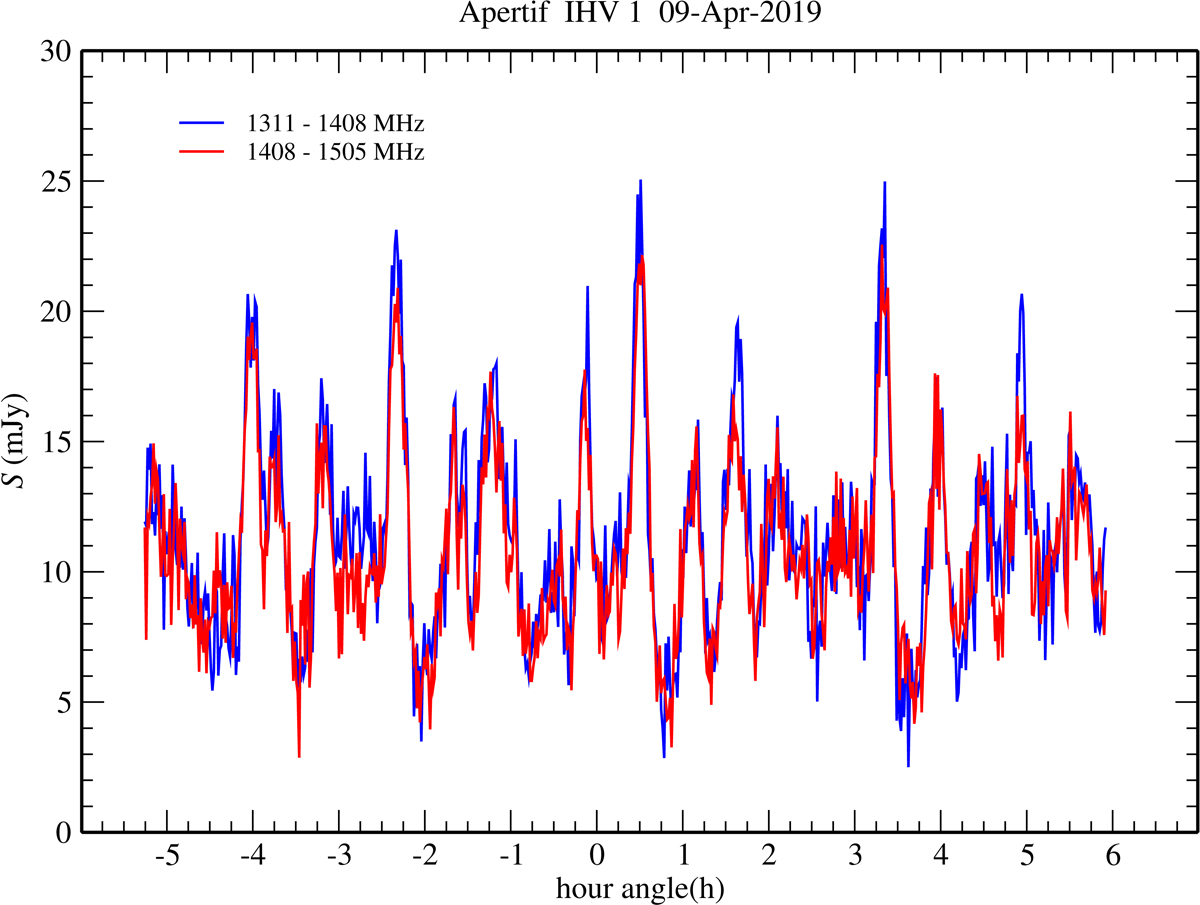
Separate light curves for the lower and upper halves of the observing band of the discovery observation on April 9, 2019. The blue line is the light curve for the frequency range 1311−1408 MHz, and the red line shows the range 1408−1505 MHz.
Current usage metrics show cumulative count of Article Views (full-text article views including HTML views, PDF and ePub downloads, according to the available data) and Abstracts Views on Vision4Press platform.
Data correspond to usage on the plateform after 2015. The current usage metrics is available 48-96 hours after online publication and is updated daily on week days.
Initial download of the metrics may take a while.