Fig. 8
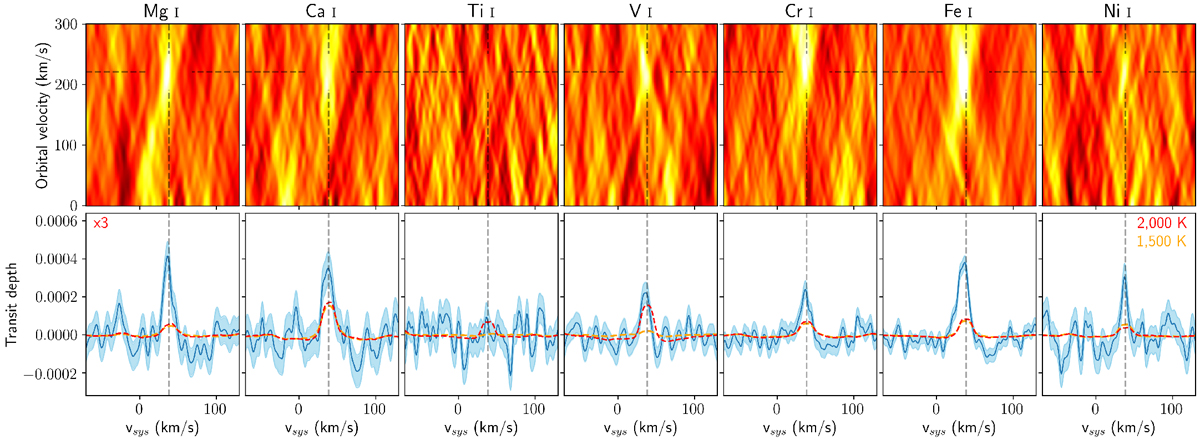
Summary of co-added cross-correlation functions in velocity–velocity space (top panels) and in the planet rest-frame (bottom panels), for various species. Dashed lines indicate the velocities at which the signature of the planet is expected to occur, given the known systemic velocity and orbital parameters of the planet. Red and yellow lines are cross-correlation functions obtained by injecting two different models into the data prior to cross-correlation. The cross-correlation functions of all surveyed species are provided in Fig. D.1. Note that although the sign of the absorption is positive in this figure, the sign was flipped earlier in the analysis to denote the flux received from the system, notably in Figs. 5 and 6. Also note that the scaling of the vertical axis of the cross-correlation function of Mg I is multiplied by a factor of three, because the line of Mg I is significantly deeper than the other atoms.
Current usage metrics show cumulative count of Article Views (full-text article views including HTML views, PDF and ePub downloads, according to the available data) and Abstracts Views on Vision4Press platform.
Data correspond to usage on the plateform after 2015. The current usage metrics is available 48-96 hours after online publication and is updated daily on week days.
Initial download of the metrics may take a while.