Fig. 6
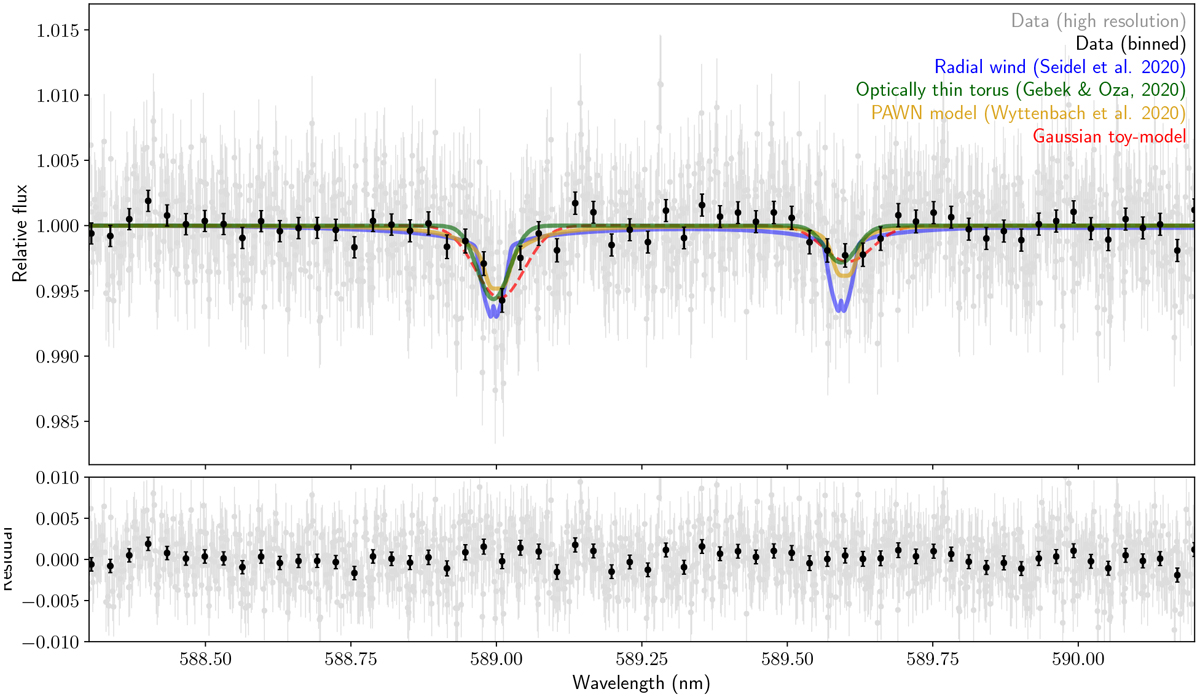
Transmission spectrum of WASP-121 b at the location of the Na I D-doublet. The spectrum was constructed from the observations obtained during night one and night three, as night two was ruled out as a spurious signal. Top panel: transmissionspectra at the native resolution of HARPS in grey, binned by 20 for better visibility in black. The transmission spectrum corresponding to the best-fit analytical model (see Sects. 3.1.2 and Appendix A) is shown in red, along with the residual of the data after subtraction in the bottom panel. Blue, green and yellow lines depict two forward-models based on a radially outflowing wind (Seidel et al. 2020), an optically thin torus (Oza et al. 2019; Gebek & Oza 2020) and a hydrodynamically escaping envelope (Wyttenbach et al. 2020). The latter two reproduce the significant difference in depth between the D1 and D2 lines.
Current usage metrics show cumulative count of Article Views (full-text article views including HTML views, PDF and ePub downloads, according to the available data) and Abstracts Views on Vision4Press platform.
Data correspond to usage on the plateform after 2015. The current usage metrics is available 48-96 hours after online publication and is updated daily on week days.
Initial download of the metrics may take a while.