Fig. 5
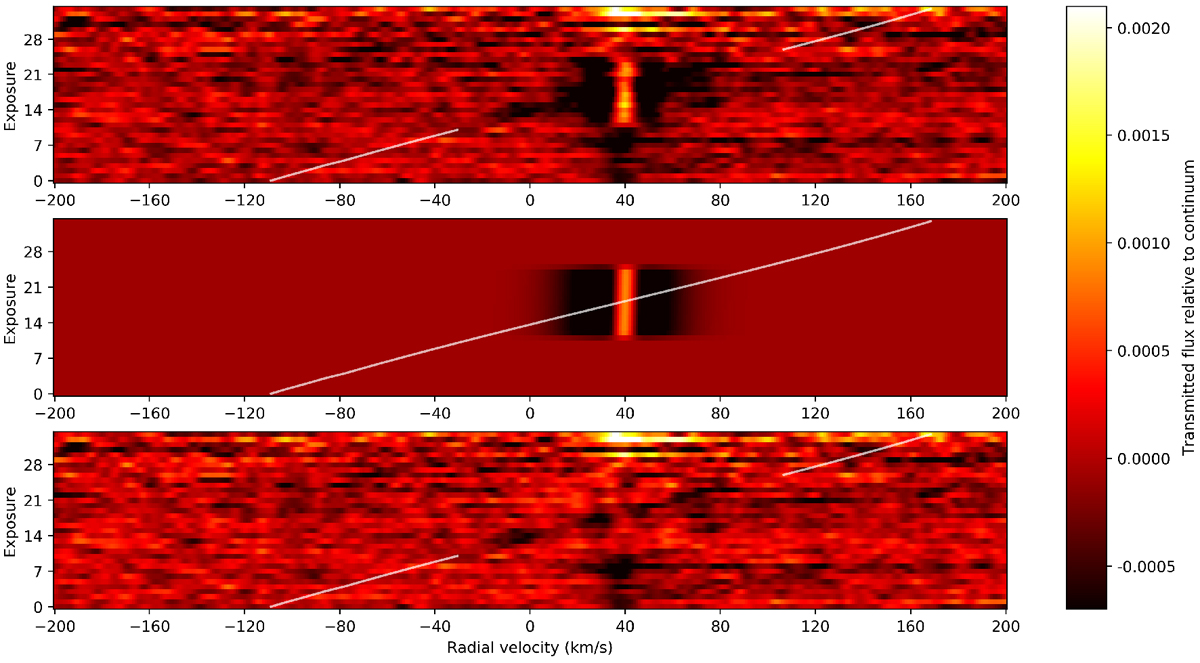
Subtraction of the Doppler shadow and emergence of the signature of the exoplanet atmosphere, following the radial-velocity curve indicated by the white line. Top panel: raw cross-correlation matrix of the first night of observationswith the Fe I template. During the transit, the Doppler shadow emerges as the near-vertical structure around 40 km s−1, because the planet is on a strongly misaligned orbit (Delrez et al. 2016; Bourrier et al. 2020b). Middle panel: best-fit model of the Doppler Shadow described as a two-component Gaussian. Bottom panel: residuals after subtracting the best-fit model from the raw cross-correlation matrix, revealing the signature of the planet atmosphere. Residuals remain in the stellar line core before and after the transit event, but these do not affect the signature of the planet atmosphere, as the latteris constructed by considering in-transit spectra only. The signature of the planet atmosphere appears as the dark slantedfeature indicated by the white line. Note that although the sign of the absorption is negative in this figure, the sign flipped further in the analysis to denote absorption, notably in Figs. 8 and 9.
Current usage metrics show cumulative count of Article Views (full-text article views including HTML views, PDF and ePub downloads, according to the available data) and Abstracts Views on Vision4Press platform.
Data correspond to usage on the plateform after 2015. The current usage metrics is available 48-96 hours after online publication and is updated daily on week days.
Initial download of the metrics may take a while.