Fig. 2
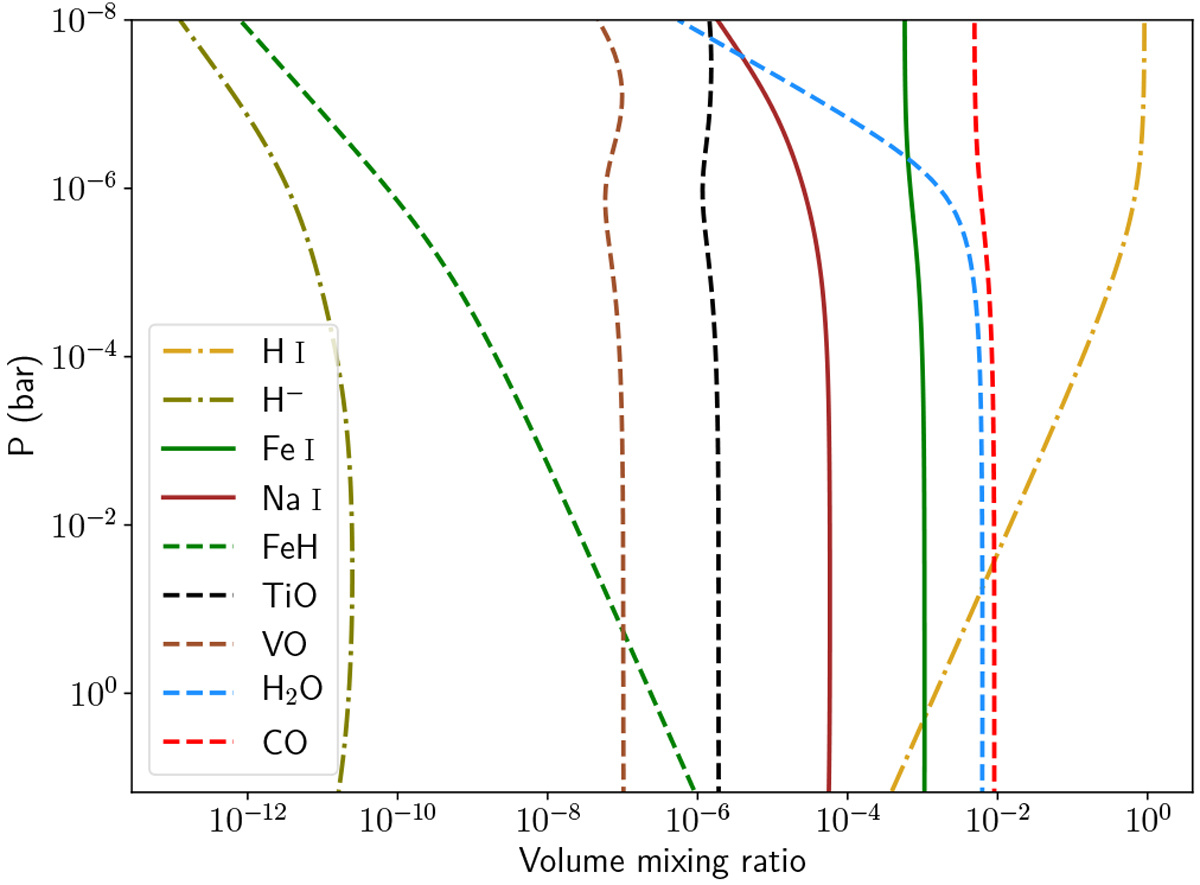
Abundance profiles of selected species at a temperature of 2000 K and 20× solar metallicity, as computed by FastChem. Solid lines correspond to atomic species, dashed lines to molecules, and dashed-dotted lines to atomic hydrogen and H−. Transmission spectroscopy is principally sensitive to pressures below the milli-bar level (e.g. Kitzmann et al. 2018).
Current usage metrics show cumulative count of Article Views (full-text article views including HTML views, PDF and ePub downloads, according to the available data) and Abstracts Views on Vision4Press platform.
Data correspond to usage on the plateform after 2015. The current usage metrics is available 48-96 hours after online publication and is updated daily on week days.
Initial download of the metrics may take a while.