Fig. D.1
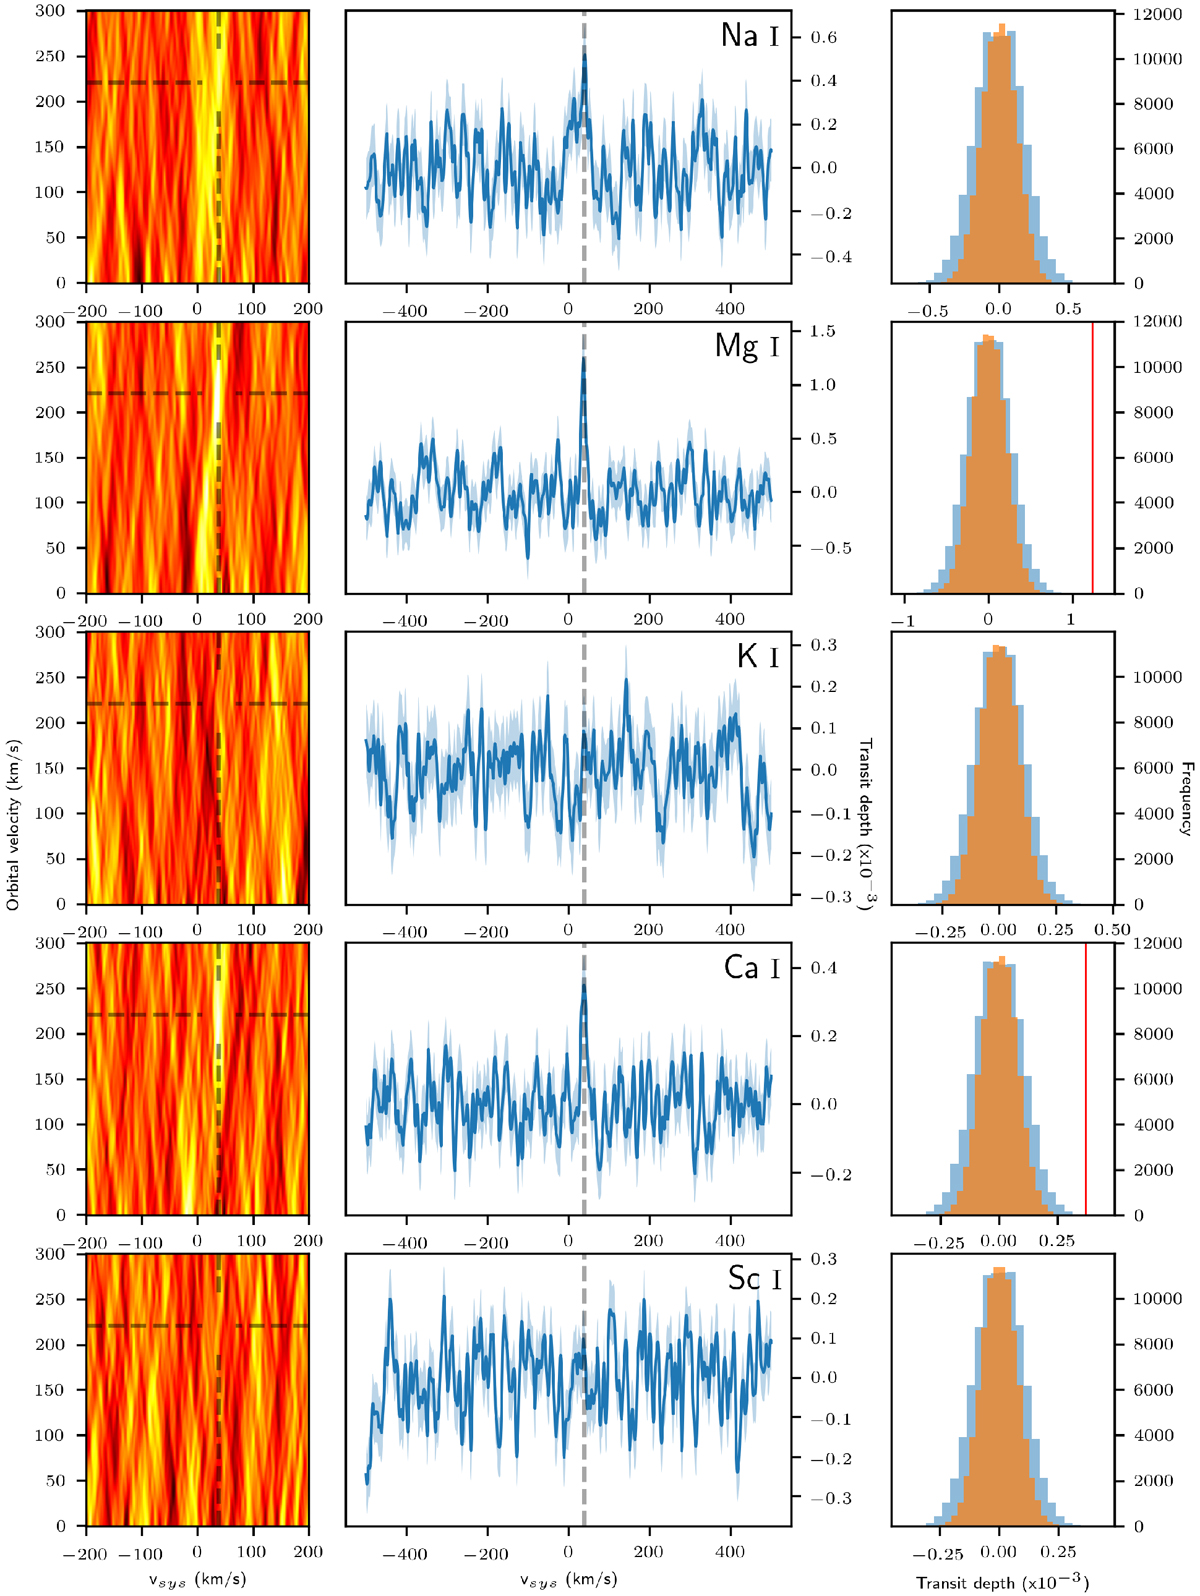
All cross-correlation functions in Kp-Vsys space (left column), and co-added in the rest-frame of the planet (middle column). The blue shaded area indicates the 1-σ error expected from photon-noise. Right column: distributions of Gaussian fits to random realisations of the 1D-cross-correlation function generated by stacking the time-series of cross-correlation functions with random shifts applied to them. Gaussian functions are fitted with fixed widths of 10 km s−1 (blue) and 20 km s−1 (orange), to match the typical width retrieved from real detections. These distributions serve toillustrate the detection significance and sensitivities for each of the tested species, given the real noise properties of the cross-correlation functions. The blue distributions (10 km s−1) are wider than the orange distributions (20 km s−1) because spurious fluctuations that are wider are less likely to occur at random. Red lines indicate the line-strengths of the detectedspecies.
Current usage metrics show cumulative count of Article Views (full-text article views including HTML views, PDF and ePub downloads, according to the available data) and Abstracts Views on Vision4Press platform.
Data correspond to usage on the plateform after 2015. The current usage metrics is available 48-96 hours after online publication and is updated daily on week days.
Initial download of the metrics may take a while.