Fig. B.1
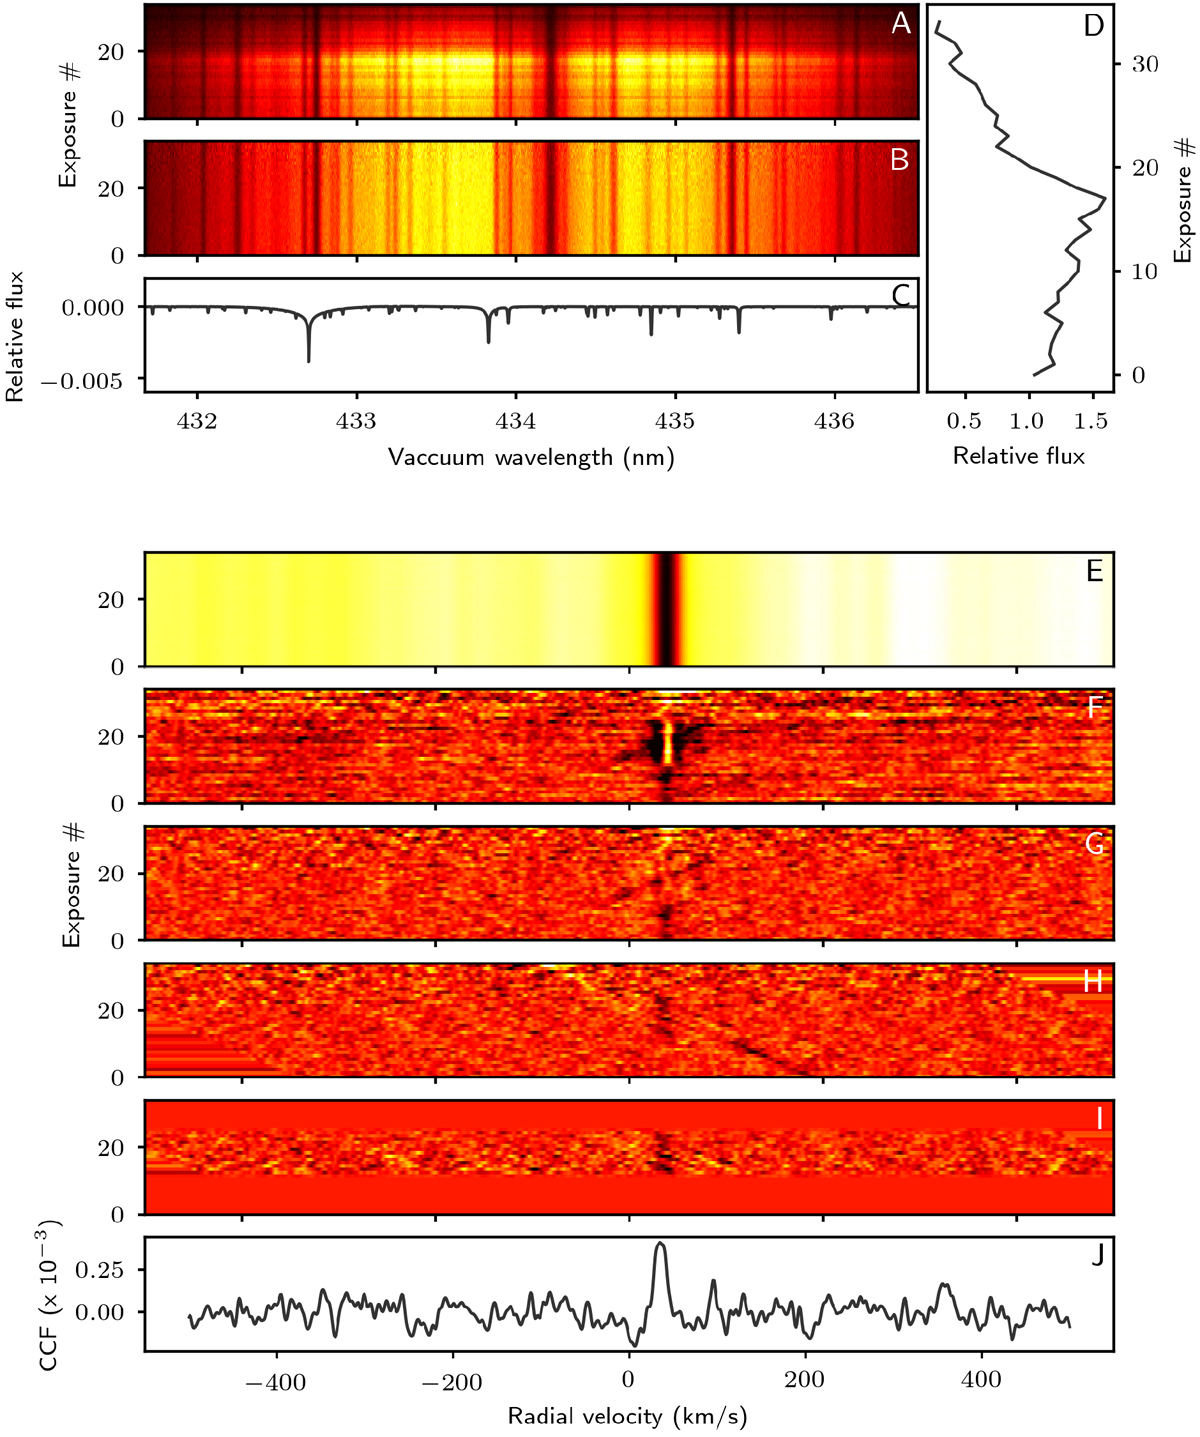
Pre-processing steps applied to obtain cross-correlation functions in the rest-frame of the planet, as described in Sect. 2.3.3. Panel A: an example spectral order of night one as extracted by the HARPS DRS, plotted as a time-series. Panel B: after normalisation by the time-average flux and colour correction. Panel C: cross-correlation template of Fe I after continuum-subtraction, with which the spectra are cross-correlated. Panel D: average flux in the spectral order, that is divided out of the spectra in panel A to obtain the spectra in panel B. Panel E: cross-correlation function of Fe I of the entire time series. Panel F: after removal of the time-average of the out-of-transit cross-correlation functions. Panel G: after removal of the Doppler shadow and application of the high-pass filter. Panel H: after shifting the cross-correlations to the rest-frame of the planet. Panel I: after weighing the cross-correlation functions by the average flux of the time-series (panel D) and selecting only in-transit observations. Panel J: one dimensional cross-correlation function in the rest-frame of the planet, after averaging the cross-correlation functions (panel I) in time.
Current usage metrics show cumulative count of Article Views (full-text article views including HTML views, PDF and ePub downloads, according to the available data) and Abstracts Views on Vision4Press platform.
Data correspond to usage on the plateform after 2015. The current usage metrics is available 48-96 hours after online publication and is updated daily on week days.
Initial download of the metrics may take a while.